本文已被:浏览 404次 下载 1858次
投稿时间:2021-07-30 修订日期:2022-06-06
投稿时间:2021-07-30 修订日期:2022-06-06
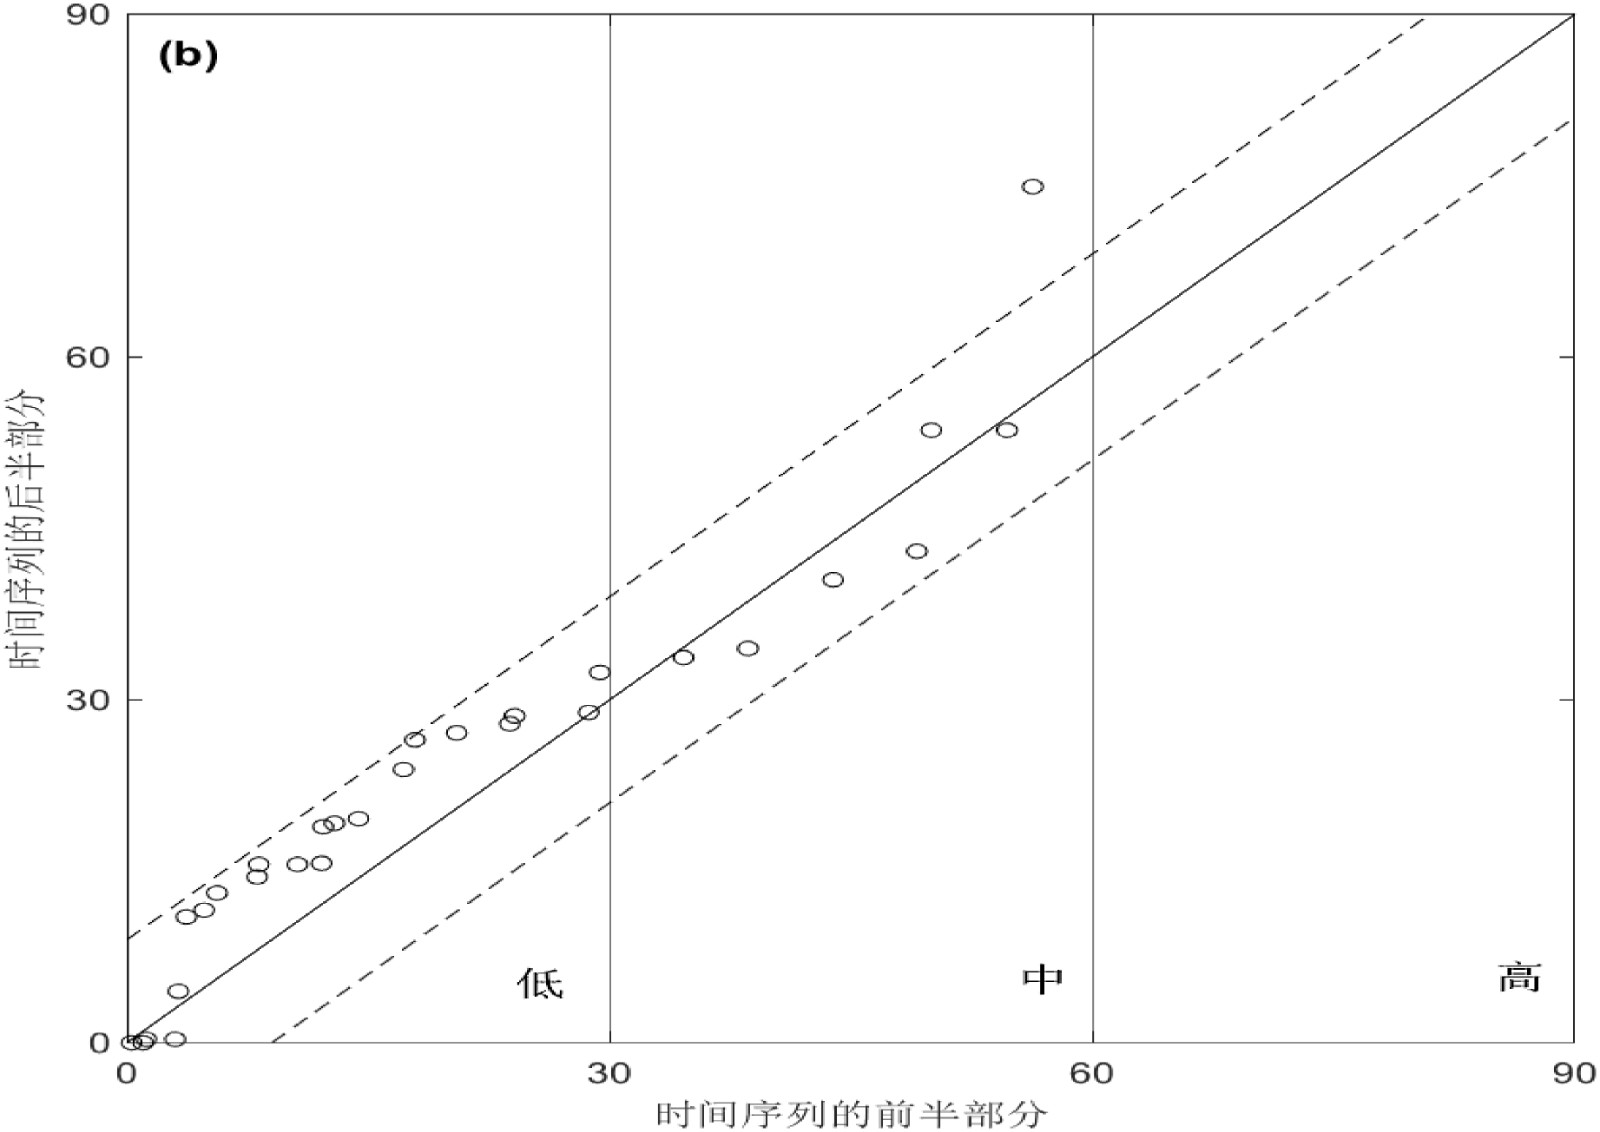
中文摘要: 基于东帕米尔高原3个气象站近58年(1961—2018年)逐月降水量资料,借助创新性趋势分析(innovative trend analysis,ITA)法、Mann-Kendall(M-K)非参数检验和Sen’s斜率估计法分析了东帕米尔高原降水量的变化趋势。结果表明:三种分析方法得出的结论具有一致性,近年来东帕米尔高原降水量呈增加趋势。Sen’s斜率估计法分析得出有69.44%的月份降水呈增加趋势,11.11%的月份呈减少趋势;M-K法分析得出有75%的月份降水呈增加趋势,22.22%的月份呈减少趋势;ITA法分析得出有94.44%的月份降水呈增加趋势,5.56%的月份呈减少趋势。三种方法在分析过程中也存在着差异性,如利用Sen’s斜率估计法分析塔什库尔干气象站点时有5个月无变化趋势,与其他两种方法分析结果差异较大。而ITA和M-K 法较为准确地辨识时间序列的变化趋势,且不受异常值影响;三种分析方法中,显著性趋势最强的是ITA法,其次是M-K 法,Sen’s斜率估计法表现较为一般。其中,ITA分析法有63.89% 的月份通过了0.10的显著性水平检验,M-K有25% 的月份通过了0.10的显著性水平检验。相较于传统分析方法,ITA的优势在于,它能够给出不同月份不同级别降水量增加或减少的范围和趋势,所以可以有效地识别传统检验无法确定的隐藏的微趋势,更有助于分析水文气象方面数据系列的变化趋势。
Abstract:Based on monthly precipitation data of three meteorological stations in the eastern pamirs during the past 58 years (1961-2018), this paper uses innovative trend analysis (ITA), Mann-Kendall (M-K) nonparametric test and Sen’s slope estimation method to analyze the variation trend of precipitation in the eastern Pamirs. The results show that the results obtained by the three methods are highly consistent. In recent years, the precipitation in the eastern pamirs has an increasing trend. According to Sen’s slope estimation method, 69.44% shows an increasing trend of precipitation, and 11.11% shows a decreasing trend. The precipitation increases in 75% of the months and decreases in 22.22% of the months by M-K method. According to ITA analysis, precipitation increases in 94.44% of the months and decreases in 5.56% of the months. However, there are also differences among the three methods in the analysis process. For example, the most obvious difference is that the β value of Tashkogan meteorological station in five months by using Sen’s slope estimation method is 0, indicating no trend of change, which is significantly different from the results of the other two methods. ITA and M-K methods can distinguish the trend of time series more accurately, and are almost not affected by outliers. In addition, ITA method has the strongest significance trend, followed by M-K method, and Sen’s slope estimation performance is relatively general. The ITA analysis has passed the 0.10 significance level test in 〖JP2〗63.89% of the months and M-K has passed the 0.10 significance level test in 25% of the months. Compared with the traditional analysis method, ITA has the advantage that it can give the range and trend of increase or decrease of different levels of precipitation in different months. Therefore, ITA can effectively identify the hidden micro trend that cannot be determined by the traditional test, and is more helpful to analyze the change trend of hydrometeorological data series.〖JP〗
文章编号: 中图分类号: 文献标志码:
基金项目:“天池博士”科研项目(tcbs201819)、新疆大学博士科研启动基金项目(BS180245)共同资助
| 作者 | 单位 |
| 王涛 | 新疆大学地理与遥感科学学院,乌鲁木齐 830017 |
| 伊丽努尔·阿力甫江 | 新疆大学地理与遥感科学学院,乌鲁木齐 830017 |
| 李思颖 | 新疆大学地理与遥感科学学院,乌鲁木齐 830017 |
| 阿依谢姆古丽·孜比不拉 | 新疆克州气象局,阿图什 845350 |
| 张心蕊 | 新疆大学地理与遥感科学学院,乌鲁木齐 830017 |
| 高腾飞 | 新疆大学地理与遥感科学学院,乌鲁木齐 830017 |
引用文本:
王涛,伊丽努尔·阿力甫江,李思颖,阿依谢姆古丽·孜比不拉,张心蕊,高腾飞,2022.三种趋势分析法在东帕米尔高原降水特征分析中的应用[J].气象,48(10):1312-1320.
WANG Tao,YILINUER Alifujiang,LI Siying,AYSHEMGULI Zibibula,ZHANG Xinrui,GAO Tengfei,2022.Three Trend Analysis Methods in Precipitation Characteristic Analysis of Eastern Pamirs[J].Meteor Mon,48(10):1312-1320.
王涛,伊丽努尔·阿力甫江,李思颖,阿依谢姆古丽·孜比不拉,张心蕊,高腾飞,2022.三种趋势分析法在东帕米尔高原降水特征分析中的应用[J].气象,48(10):1312-1320.
WANG Tao,YILINUER Alifujiang,LI Siying,AYSHEMGULI Zibibula,ZHANG Xinrui,GAO Tengfei,2022.Three Trend Analysis Methods in Precipitation Characteristic Analysis of Eastern Pamirs[J].Meteor Mon,48(10):1312-1320.


