本文已被:浏览 522次 下载 3914次
投稿时间:2022-05-17 修订日期:2022-10-13
投稿时间:2022-05-17 修订日期:2022-10-13
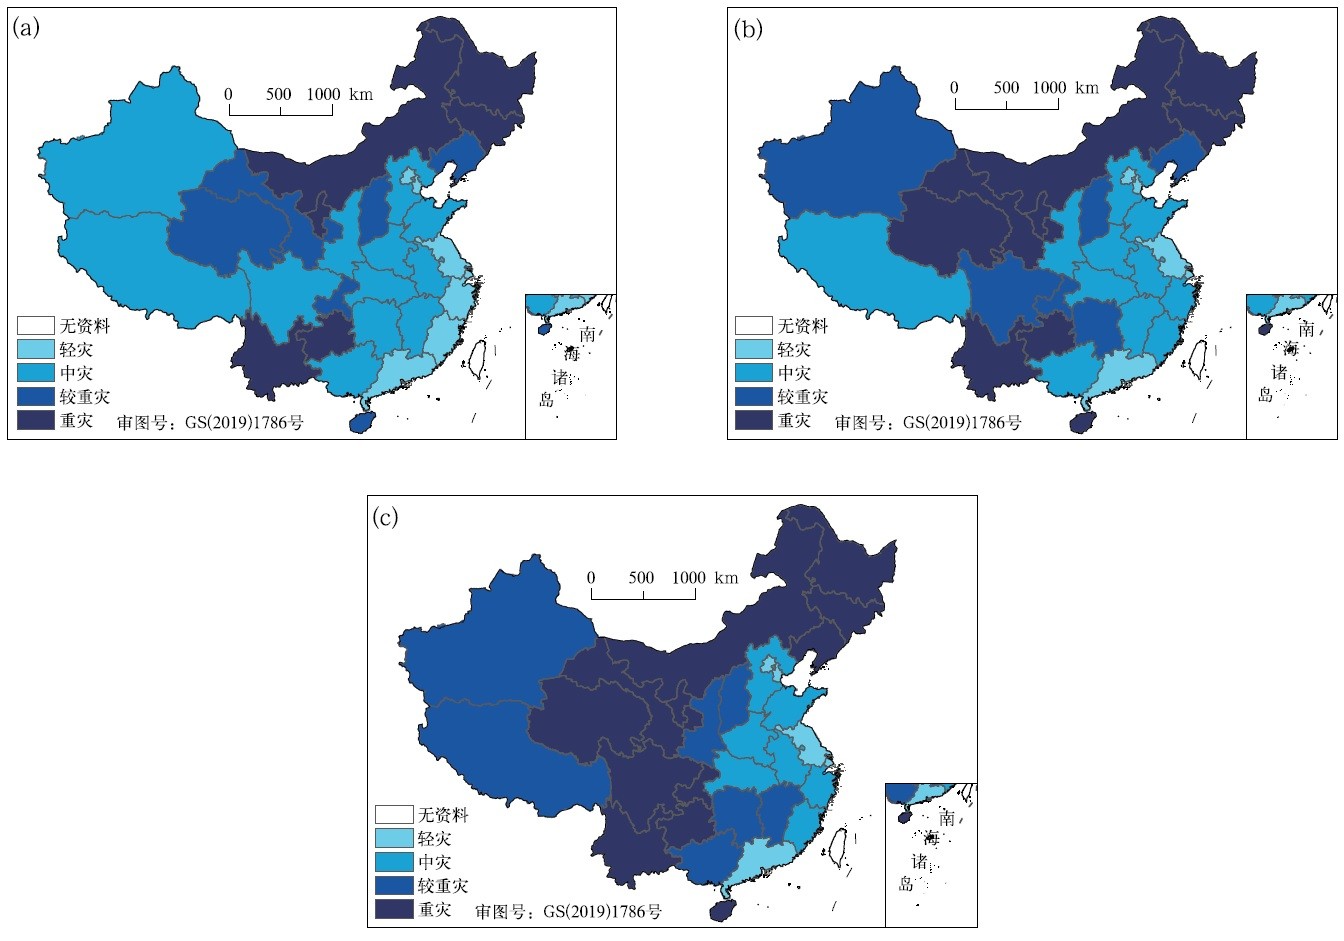
中文摘要: 基于2004—2019年中国省级年干旱灾情和社会经济资料,对干旱农作物受灾面积、受灾人口和直接经济损失三个指标及其灾损率的时空变化规律进行分析,采用信息扩散方法开展不同承灾体的干旱灾损率风险评估,为摸清近十几年的干旱风险格局,提高灾害风险管理能力提供参考。结果表明:三个指标的年干旱灾损率均呈现下降趋势,其中年农作物受灾面积和人口受灾率减少趋势显著,年降水量增加、年干旱累积强度和干旱日数减少以及防灾抗旱能力增强为主要原因。农作物、人口和经济不同承灾体的干旱风险格局存在差异。出现农作物面积受灾率≥20%时的旱灾可能性不高,仅宁夏、山西、内蒙古、甘肃超越概率达较高等级,出现人口受灾率≥30%和直接经济损失率≥1%时的旱灾可能性更低,超越概率小,无省份达高、较高可能性等级。年农作物面积受灾率20年一遇水平下,干旱重灾区分布在西北地区、西南地区东部及湖北、湖南、浙江、海南。年人口受灾率20年一遇水平下,干旱重灾区位于西北地区中东部、西南地区东部以及安徽、山西、内蒙古。年直接经济损失率20年一遇水平下,干旱重灾区集中在东北、西北地区中部、西南地区东部及内蒙古、海南。
中文关键词: 干旱,承灾体,风险评估,信息扩散方法
Abstract:Based on the provincial annual drought disaster losses and socio-economic data of China from 2004 to 2019, spatio-temporal variation characteristics are analyzed for the three loss indexes and their loss rates, including the crop area, population affected by drought and direct economic loss caused by droughts. Risk assessment of drought loss rates for different hazard bearing bodies are carried out by the information diffusion method so as to understand the drought risk pattern and provide reference for improving the ability of drought risk management. The results show that the annual disaster loss rates of the three indexes caused by drought tend to decrease in China during 2004 and 2019, in which the loss rates of crop area and population show decreasing trends significantly. This is the result of the increase of annual precipitation, decrease of annual drought cumulative intensity and days with moderate drought grade and above, as well as the enhancement of drought resistance capacity. The drought risk patterns of the three types of hazard bearers are different. When the annual rate of crop area affected by drought to sown area is greater than and equal to 20%, only Ningxia, Shanxi, Inner Mongolia and Gansu have a higher exceeding possibility level. When the rate of population affected by drought to total population is greater than and equal to 30% and the rate of direct economic losses to GDP is greater than and equal to 1%, the exceeding probability is small and there is no province with high or higher possibility grade. Under the level of 20-year return period of annual rate of crop area affected by drought to sown area, the serious drought area distributed in the whole Northwest China, eastern Southwest China and the provinces of Hubei, Hunan, Zhejiang and Hainan. Under the level of 20-year return period of annual rate of population affected by drought to total population, the serious drought area was located in the middle and east of Northwest China, eastern Southwest China, and the provinces of Anhui, Shanxi, Inner Mongolia. Under the level of 20-year return period of annual rate of direct economic losses to GDP, the serious drought area is located in Northeast China, central Northwest China, eastern Southwest China as well as the provinces of Inner Mongolia, Hainan.
文章编号: 中图分类号: 文献标志码:
基金项目:国家重点研发计划(2018YFC1509002)、科学技术部—第四次气候变化国家评估报告编制工作专项共同资助
引用文本:
高歌,李莹,陈涛,赵珊珊,黄大鹏,2023.2004—2019年中国干旱多承灾体灾损风险特征评估[J].气象,49(5):611-623.
GAO Ge,LI Ying,CHEN Tao,ZHAO Shanshan,HUANG Dapeng,2023.Characteristics and Risk Assessment of Drought Losses for Different Hazard Bearing Bodies in China from 2004 to 2019[J].Meteor Mon,49(5):611-623.
高歌,李莹,陈涛,赵珊珊,黄大鹏,2023.2004—2019年中国干旱多承灾体灾损风险特征评估[J].气象,49(5):611-623.
GAO Ge,LI Ying,CHEN Tao,ZHAO Shanshan,HUANG Dapeng,2023.Characteristics and Risk Assessment of Drought Losses for Different Hazard Bearing Bodies in China from 2004 to 2019[J].Meteor Mon,49(5):611-623.