本文已被:浏览 809次 下载 3917次
投稿时间:2019-09-25 修订日期:2020-07-20
投稿时间:2019-09-25 修订日期:2020-07-20
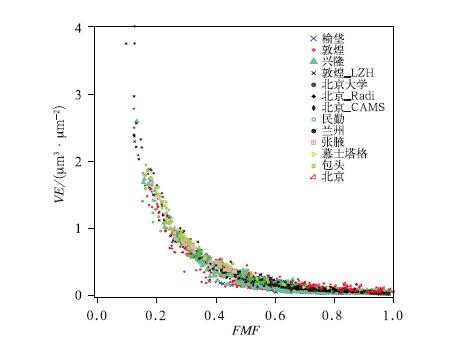
中文摘要: 利用PMRS(physical PM2.5 remote sensing)方法,对FY-4A卫星资料进行反演,并通过与地面站点资料融合,得到我国近地面PM2.5网格化实况。建立清洁、霾、沙尘背景条件下PM2.5与PM10转化关系的格点地图,进一步估算我国地表PM10浓度。结果表明,不同区域间细粒子柱状体积消光比(VEf)与大气细粒子比(FMF)均存在相似的相关关系,以FMF=0.4 为界,分别建立了两个VEf拟合方程,估算得到的VEf与AERONET观测的VEf相关性(r2)高于0.85。霾过程中,通过PMRS方法反演得到的近地面PM2.5质量浓度与实况站点分布有较好的匹配,基本可以反映出污染的高浓度区域,单点检验中,反演结果与实况数据存在一定的相关性,其中京津冀的r2可达0.39,但数值上仍存在高估或低估。为了解决这一问题,本研究将卫星反演格点结果与地面观测站点进行融合,最终得到与实况吻合较好的0.25°×0.25°全国PM2.5网格化实况。不同天气背景条件下各站点PM10和PM2.5相关性均高于0.7。其中,沙尘时段PM10/PM2.5>3高值区与我国沙源地和沙尘高发区有较好的对应关系。霾时段PM10/PM2.5接近于1,清洁时段,全国大部PM10/PM2.5介于1~2。通过PM2.5与PM10转化关系的格点地图,根据不同天气背景,反演得到我国网格化地表PM10实况,其结果可以较好地反映我国西北地区的沙尘天气过程。
中文关键词: FY-4A,PMRS方法,PM2.5,PM10,相关性
Abstract:In this study, the physical PM2.5 remote sensing (PMRS) method was used to invert the FY-4A observation data, and through the fusion with the surface station data, the near-surface PM2.5 gridding observation data in China were obtained. A grid map of the relationship between PM2.5 and PM10 was established under different conditions of clean, haze and dust background, and PM10 concentration in China was further estimated. The results showed that there is a similar correlation between columnar volume-to-extinction ratio of fine particulates (VEf) and fine mode fraction (FMF) in different regions. With FMF=0.4 as the boundary, two fitting equations of VEf are established respectively. The estimated correlation (r2) between VEf and AERONET observation is higher than 0.85. During the haze period, the PM2.5 mass concentration obtained by PMRS has a good match with the observation site distribution, which can basically reflect the high concentration area of pollution. In single point test, the remote sensing result has a certain correlation with the surface observation, with r2 reaching 0.39 in the region of Beijing-Tianjin-Hebei. However, to some extent there is still overestimation or underestimation in the value of inversion compared to surface observation data. In order to solve this problem, the study combines the satellite inversion grid results with the surface observation site, and finally obtains a 0.25°×0.25° national PM2.5 gridding observation data that are in good agreement with the surface observation data. The r2 between PM10 and PM2.5 is higher than 0.7 under different weather conditions. Among them, the value PM10/PM2.5>3 matches with the sand source area and the high dust area in China during the dust period. During the haze period, PM10/PM2.5 is close to 1, and the value is between 1 and 2 during cleaning period for most stations. Through the grid map of the relationship between PM2.5 and PM10, according to different weather backgrounds, the gridded surface PM10 in China is obtained, and the results can better reflect the dust process in Northwest China.
文章编号: 中图分类号: 文献标志码:
基金项目:国家重点研发计划(2019YFC0214602)、国家自然科学基金项目(41875181)、中国气象局气象预报业务关键技术发展专项[YBGJXM(2019)02-02]、国家气象中心预报员专项(Y201919和Y201917)和上甸子国家大气本底站开放研究课题(SDZ2020613)共同资助
| 作者 | 单位 |
| 江琪 | 国家气象中心,北京 100081 上甸子国家大气本底站,北京 101507 |
| 桂海林 | 国家气象中心,北京 100081 |
| 张天航 | 国家气象中心,北京 100081 |
| 王飞 | 中国气象科学研究院,北京 100081 |
| 张碧辉 | 国家气象中心,北京 100081 |
| 迟茜元 | 国家气象中心,北京 100081 |
| 徐冉 | 国家气象中心,北京 100081 |
引用文本:
江琪,桂海林,张天航,王飞,张碧辉,迟茜元,徐冉,2020.基于FY-4A卫星资料的中国区域网格化地表大气颗粒物浓度估算[J].气象,46(10):1297-1309.
JIANG Qi,GUI Hailin,ZHANG Tianhang,WANG Fei,ZHANG Bihui,CHI Xiyuan,XU Ran,2020.Estimation of Gridding Surface Atmospheric Particle Matter Concentration in China Based on FY-4A Satellite Observation[J].Meteor Mon,46(10):1297-1309.