本文已被:浏览 1272次 下载 3476次
投稿时间:2018-05-03 修订日期:2019-03-29
投稿时间:2018-05-03 修订日期:2019-03-29
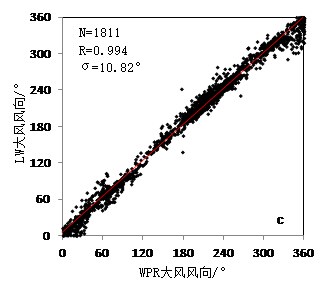
中文摘要: 基于相同站点的济南边界层风廓线雷达(WPR)和L波段雷达大风探空测风(以下简称LW)资料,采用相关、拟合、廓线分析等方法,系统地对比两者大风(≥10.8 m·s-1)数据的各统计特征、相关性、时空变化规律的异同。结果表明:(1)两者u分量、v分量、风向、风速的相关系数分别为0.973、0.965、0.994、0.665,标准偏差分别为2.04 m·s-1、2.88 m·s-1、10.82°、2.53 m·s-1,大风数据相关性总体较高,且相关系数风向优于风速的、降水样本优于非降水的,表明WPR观测大风数据可信、降水期间WPR水平大风数据可以使用。(2)两者大风风向、风速基本一致,但在低层差异较高层的大,尤其是340 m及以下高度层更显著,降水、非降水、全部样本在2980、1900、2740 m以下WPR风向值均略小于LW,而在1300、2740、1660 m以下WPR风速值均略大于LW。(3)两者资料互补性总体较好,大风风向、风速、v分量差值随高度变化符合对数律递增或递减规律,但u分量需分段拟合;在进行回归方程求算和资料互补时,应考虑差异随高度等的变化。
中文关键词: 边界层风廓线雷达,L波段雷达,大风,标准偏差法,资料互补
Abstract:Based on the strong wind (≥10.8 m·s-1) data observed by Jinan boundary layer wind profile radar (WPR) and L-band sounding radar (LW) located in the same place, statistical correlation, fitting, and profile analysis were used to systematically compare the similarities and differences between spatial and temporal changes of both of them. The results show that the correlation coefficients of the u-component, v-component, wind direction, and wind speed are 0.973, 0.965, 0.994, and 0.665 respectively. The standard deviations are 2.04 m·s-1, 2.88 m·s-1, 10.82° and 2.53 m·s-1 respectively. The correlations of the two observed strong wind data are relatively high, with wind direction samples better than speed samples and precipitation period samples better than that of non-precipitation period samples. This indicates that the strong wind data observed by WPR are credible and the WPR horizontal wind data during precipitation period can be used. The strong wind direction and speed of the two observations are basically the same, but the differences at lower levels are bigger, especially at the heights of 340 m and below. Below the heights of 2980 m, 1900 m, and 2740 m the wind direction samples of WPR during precipitation periods, non-precipitation periods, and the whole periods have slightly lower values than that of LW. However, the wind speeds of WPR below 1300 m, 2740 m, and 1660 m are slightly bigger than that of LW. The overall complementarity of the two data is good, and the differences in wind direction, wind speed, and v-component of the two types are in accordance with the e-index law or the law of logarithm increase or decrease, but the u-component needs to be fitted by segments. When the regression equation is calculated, variations in height should be taken into account.
文章编号: 中图分类号: 文献标志码:
基金项目:山东省气象局气象科学技术重点研究项目(2014sdqxz05)资助
| 作者 | 单位 |
| 王栋成 | 山东省气候中心,济南 250031 |
| 邱粲 | 山东省气候中心,济南 250031 上海师范大学地理系,上海 200234 |
| 董旭光 | 山东省气候中心,济南 250031 |
| 曹洁 | 山东省气候中心,济南 250031 |
引用文本:
王栋成,邱粲,董旭光,曹洁,2019.济南边界层风廓线雷达与L波段雷达大风探空测风对比[J].气象,45(8):1169-1180.
WANG Dongcheng,QIU Can,DONG Xuguang,CAO Jie,2019.Comparing Strong Wind Data Observed by Boundary Layer Wind Profiling Radar and L-Band Radar in Jinan[J].Meteor Mon,45(8):1169-1180.
王栋成,邱粲,董旭光,曹洁,2019.济南边界层风廓线雷达与L波段雷达大风探空测风对比[J].气象,45(8):1169-1180.
WANG Dongcheng,QIU Can,DONG Xuguang,CAO Jie,2019.Comparing Strong Wind Data Observed by Boundary Layer Wind Profiling Radar and L-Band Radar in Jinan[J].Meteor Mon,45(8):1169-1180.


