本文已被:浏览 908次 下载 3923次
投稿时间:2018-02-21 修订日期:2019-03-14
投稿时间:2018-02-21 修订日期:2019-03-14
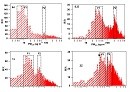
中文摘要: 利用2016年12月至2017年2月北京、天津、石家庄和郑州的PM2.5质量浓度、反应性气体质量浓度及其相对应的气象要素资料分析了大气污染的理化特征、传输和生消规律。结果表明:北京、石家庄、天津及郑州的PM2.5质量浓度分布频率均有两个较为明显的峰值,四个地区PM2.5质量浓度分布频率最高时均值分别为10.1、19.2、40.0和47.1 μg?m-3,大气的氧化程度为北京最低,其次为石家庄、天津,郑州最高。四个研究地区的交通源对环境大气污染均有重要贡献。PM2.5和CO的相关性在低相对湿度时高于高相对湿度时;而PM2.5和NO2的相关性在相对湿度较大时高于相对湿度较小时。四个研究地区的PM2.5质量浓度均随风速的增大呈快速降低后趋于平缓的趋势,其中北京、石家庄和郑州的风速阈值均为3 m?s-1,天津地区为4 m?s-1。受上游污染地区的影响,偏南风的输送作用滞后20~30 h达到最大,而偏北风的影响作用在滞后8~12 h 达到最大。
中文关键词: PM2.5,气象要素,风速,反应性气体
Abstract:Based on the observations of PM2.5 mass concentration, reactive gases and related meteorological elements in Beijing, Tianjin, Shijiazhuang and Zhengzhou from December 2016 to February 2017, the physical and chemical characteristics of the air pollution, transmission and elimination rules are discussed. The results show that the frequency distributions of PM2.5 mass concentration in Beijing, Shijiazhuang, Tianjin and Zhengzhou all had two obvious peaks. The mean values of PM2.5 concentrations were 10.1, 19.2, 40.0 and 47.1 μg?m-3 in the four regions respectively at the time with the highest PM2.5 frequency distribution. The degree of air oxidation in Beijing was the lowest followed by Shijiazhuang, Tianjin and Zhengzhou in order. Traffic sources had important contribution to the environmental air pollution in the four study areas. The correlation between CO and PM2.5 at low relative humidity was higher than that with high humidity. However, the correlation between NO2 and PM2.5 at low relative humidity was lower than that with high humidity. With the wind speed increasing, the PM2.5 mass concentration decreased rapidly and then tended to be gentle, of which the wind speed threshold was 3 m?s-1 in Beijing, Shijia zhuang and Zhengzhou, and for Tianjin it was 4 m?s-1. Affected by upstream pollution transport, southerly wind transport effect was about 20-30 h later than reaching the maximum and the effect of the northerly wind delayed 8-12 h before reaching the maximum.
文章编号: 中图分类号: 文献标志码:
基金项目:国家重点研发计划项目(2016YFC0203301)、国家基金委重点研究项目 (91644223)和中国气象局预报员专项(CMAYBY2018 092)共同资助
| 作者 | 单位 |
| 江琪 | 国家气象中心,北京 10008 |
| 王飞 | 中国气象科学研究院,北京 100081 |
| 张恒德 | 国家气象中心,北京 10008 |
| 吕梦瑶 | 国家气象中心,北京 10008 |
| 何佳宝 | 浙江省宁波市环境监测中心,宁波 315012 |
引用文本:
江琪,王飞,张恒德,吕梦瑶,何佳宝,2019.2016年冬季京津冀豫大气污染的时空分布及影响因子研究[J].气象,45(5):695-704.
JIANG Qi,WANG Fei,ZHANG Hengde,Lv Mengyao,HE Jiabao,2019.Analysis of Spatio Temporal Distribution and Connecting Factors of Air Pollution in Beijing, Tianjin, Shijiazhuang and Zhengzhou in Winter of 2016[J].Meteor Mon,45(5):695-704.