2. 许健民气象卫星创新中心, 北京 100081
2. Innovation Center for FengYun Meteorological Satellite (FYSIC), Beijing 100081
陆表温度是区域与全球陆表物理过程的关键参数,在地-气物质与能量交换过程中起着重要的作用,对区域和全球环境和气候变化具有重要的指示意义。遥感由于覆盖面积大、重访周期短的观测优势,越来越成为陆表温度监测的重要手段。LANDSAT TM/ETM/ETM+/TIRS、NOAA AVHRR、EOS MODIS、FY-3 VIRR/MERSI、MSG SEVIRI、GOES-R ABI以及FY-4 AGRI等卫星遥感器均可以进行热红外陆表温度观测,在光谱分辨率、时间分辨率和空间分辨率等方面各有优势。基于热红外遥感的陆表温度反演方法经过长期发展已经取得了令人满意的成果,可以获得优于1 K精度的晴空陆表温度遥感产品(Wan et al, 2004; Duan and Li, 2016),但卫星遥感热红外陆表温度观测高时间分辨率和高空间分辨率难共存,而且由于热红外遥感无法穿透云层,有云地区陆表温度遥感数据存在缺失。因此,本文旨在针对静止气象卫星遥感陆表温度空间分辨率低的问题(如先进的静止轨道辐射成像仪FY-4A AGRI陆表温度空间分辨率为4 km),进行空间降尺度处理,以得到时间分辨率高、空间分辨率较高的陆表温度;针对极轨气象卫星遥感陆表温度受云覆盖影响的问题(如FY-3D MERSI陆表温度云下信息缺失),对其进行云下结果重构,以得到全天候的热红外陆表温度。无论遥感陆表温度空间降尺度,还是陆表温度云下重构,国内外研究者均已开展了大量的研究。
(1) 遥感陆表温度空间降尺度
遥感陆表温度空间降尺度,即遥感陆表温度空间分辨率提高。根据所用数据源的不同,遥感陆表温度空间降尺度方法可以分为同源降尺度和异源降尺度两种。同源降尺度也就是相同遥感平台陆表温度和相关通道间的降尺度(Rodriguez-Galiano et al,2012;李小军等,2016);异源降尺度也就是不同遥感平台陆表温度和相关通道间的降尺度(Yang et al, 2011;Weng et al, 2014;周纪,2010;段四波,2016)。根据空间降尺度方法的理论基础不同,遥感陆表温度空间降尺度可分为图像融合法、尺度因子法和机器学习法三种(全金玲等,2013)。图像融合法通过较高空间分辨率数据与较低空间分辨率陆表温度的融合运算,保留图像的高频信息,使融合所得陆表温度的细部特征更清晰(Aiazzi et al,2005;Fasbender et al,2008);尺度因子法主要考虑影响陆表温度的不同物理因素,并考虑降尺度前后热辐射信息的一致性。有的基于影响陆表温度的相对静态的因素(Kustas et al, 2003;Weng et al,2004;Agam et al, 2007;Inamdar et al, 2008;聂建亮等, 2011;Eswar et al, 2016);有的基于影响陆表温度的随时间变化的因素(Merlin et al,2010;Stathopoulou and Cartalis, 2009);有的同时考虑了多种静态和动态参数(Dominguez et al, 2011;Zakšek and Oštir,2012;Essa et al, 2012;Zhu et al, 2013)。随着新一代静止气象卫星热红外遥感的发展,基于温度日变化模型的陆表温度空间降尺度方法也得到较好发展(周纪,2010)。Zhan et al(2011)则从数据同化的角度建立了陆表温度降尺度方法的统一理论框架,并就不同影响因素进行了探讨。机器学习法是近年来不少研究者逐渐探索的陆表温度空间降尺度方法,此类方法不需要复杂的物理机制,而且计算精确度较高(汪子豪等,2018;Yang et al, 2010; 2017;华俊玮等,2018)等。
(2) 遥感云下陆表温度重构
云对地表辐射的影响一直以来受到大家的关注(宋庆利等,2005;闵敏和吴晓,2020),热红外遥感陆表温度云下重构也发展了多种不同的方法。时间插值法:一般用于静止气象卫星,基于研究区内一天可能出现的多次晴空情况,根据其多时次晴空陆表温度数据构建当日的陆表温度变化曲线,从曲线中估算有云时刻的陆表温度(Minnis and Harrison, 1984)。空间插值法:常见的有反距离权重、规则样条函数、克里金、趋势面等(杜文涛等,2011;涂丽丽等,2011;Goovaerts,2000)。时空联合插值法:时间插值和空间插值的联合使用,进一步提高估算精度(王爱辉等,2021)。辅助数据与陆表温度回归法:包括陆表温度与风速、太阳天顶角、晴空像元陆表温度经验模型、陆表温度与气温经验模型和NDVI-陆表温度经验模型等(刘梅等,2011)。能量平衡法:基于地表能量平衡方程,利用地表长波辐射、感热通量、潜热通量和地表短波辐射之间的经验线性关系实现云覆盖像元陆表温度估算(王斐等,2019)。
因此,对于静止气象卫星陆表温度空间降尺度,基于所采用卫星遥感数据的特点,本文发展了同时考虑陆表温度的静态和动态影响因素以及动态因素的日变化特征的方法,而且除下垫面参数外,其他参数均不跨平台获取,以尽可能减少数据之间时空匹配对降尺度结果的不确定性,从而得到高时间分辨率、较高空间分辨率的遥感陆表温度。并将其应用到我国FY-4A AGRI陆表温度的空间降尺度,得到每天40个时次、2 km空间分辨率的陆表温度产品。对于极轨气象卫星云下热红外陆表温度的重构,本文从时空插值方法的思路出发,借助当前在海表云下缺失参数重构中经常使用的DINEOF方法,并考虑陆表的强空间异质性,增加了基于LU(land-use)数据的二次订正,进一步提高重构陆表温度的精度。并将其应用到FY-3D MERSI陆表温度的云下重构,得到全天候的陆表温度结果。
1 数据源静止气象卫星陆表温度空间降尺度是基于我国FY-4A AGRI陆表温度开展的。FY-4A于2016年12月11日发射,搭载其上的AGRI遥感器热红外通道星下点空间分辨率为4 km,其有全圆盘和中国区域两种观测模式,其中全圆盘数据时间分辨率为15 min,中国区域数据时间分辨率为5 min。本文FY-4A AGRI陆表温度空间降尺度所使用的数据源及特征如下。(1)FY-4A AGRI陆表温度:空间分辨率为4 km(星下点),每天205次观测;(2)FY-4A AGRI第7波段亮温:时间分辨率为2 km(星下点),空间分辨率为5 min;(3)下垫面类型:自FY-4A产品系统获取,已经完成与FY-4A AGRI 4 km和2 km数据的空间匹配。
极轨气象卫星陆表温度云下重构是基于FY-3D MERSI白天晴空陆表温度发展的,该部分所使用的主要数据源及特征如下。(1)FY-3D MERSI陆表温度:空间分辨率为250 m,过境时间约为当地时间13:30;(2)下垫面类型:2020年MODIS的MCD12年际土地利用数据,空间分辨率为0.05°。
2 方法 2.1 静止气象卫星陆表温度空间降尺度模型由于FY-4A AGRI高时频的成像特征,每日可以提供40个时次全圆盘的观测以及165个时次的中国区域观测,为基于同平台多时相观测建立陆表温度空间降尺度模型提供了条件。本文所发展的静止气象卫星陆表温度空间降尺度方法主要包括两个关键步骤,一是基于陆表温度和相关参数日变化特征的空间降尺度模型的建立,二是基于局地能量平衡原理的降尺度结果的优化。
2.1.1 不同下垫面类型FY-4A AGRI陆表温度与第7通道亮温分时间段统计模型的建立不同下垫面类型的陆表温度虽然相同时刻数值大小有差异,但具有相似的日变化趋势。不同下垫面FY-4A AGRI陆表温度和第7通道亮温统计模型的建立是在低空间分辨率(4 km)上进行的,并假设两者的关系不随空间分辨率的变化而变化,将其应用到较高空间分辨率的影响因素上,从而实现FY-4A AGRI陆表温度的空间降尺度。模型建立前,首先将2 km空间分辨率的FY-4A AGRI第7通道亮温基于最近邻方法升尺度到4 km;然后,将一天内的观测分为温度上升和温度下降两个时间段分别进行建模;最后,计算所有下垫面陆表温度之和达到最大值的时刻,之所以采用所有下垫面陆表温度之和达到最大值的时刻作为分界点,而不是采用不同下垫面陆表温度达到最大值的时刻分别作为分界点,是为了整个研究区时间分界点的统一,同时减少算法的复杂性,由此引起的降尺度结果的偏差在后续降尺度结果的优化过程中可以得到进一步修正。以此作为时间的分界,并分别建立此时刻前、后两时间段陆表温度与第7通道升尺度亮温之间的对数函数关系,即:
| $ y=a \ln x+b $ | (1) |
式中:x代表FY-4A AGRI第7通道升尺度亮温,y代表FY-4A AGRI陆表温度,a、b是待拟合的系数。
统计结果表明,各下垫面FY-4A AGRI陆表温度与第7通道升尺度亮温均呈较好的对数函数关系,不同时间段相关系数均高达1。假设所建立的模型不随空间尺度变化,基于第7通道亮温(2 km)计算得到前、后时间段内各时刻2 km的陆表温度,即为降尺度的初步结果。
2.1.2 FY-4A AGRI陆表温度降尺度初步结果的进一步优化以上所建立的模型充分利用了陆表温度对下垫面类型的依赖及陆表温度的日变化趋势,基于此降尺度模型所得的结果难免在像元尺度存在一定偏差。因此,根据局地能量守恒原理,需要对其进一步优化。首先,对降尺度所得的陆表温度基于最近邻方法升尺度到4 km;然后,计算升尺度结果与原始FY-4A AGRI陆表温度之间的差值;最后,按一定比例将所得的差值分配到降尺度所得的结果中。具体公式如下:
| $ \Delta \operatorname{LST}_{\left(i_0, j_0\right)}=\operatorname{LST}_{\left(i_0, j_0\right)}^{\mathrm{tdu}}-\operatorname{LST}_{\left(i_0, j_0\right)}^{\text {ori }} $ | (2) |
| $ \operatorname{LST}_{(i, j)}^{\mathrm{sd}}=\mathrm{LST}_{(i, j)}^{\mathrm{td}} \pm 4 p_{(i, j)} \Delta \mathrm{LST}_{\left(i_0, j_0\right)} $ | (3) |
| $ {p_{(i,j)}} = \frac{{{\rm{BT}}_{(i,j)}^7}}{{\sum\limits_{m = i}^{i + 1} {\sum\limits_{n = j}^{j + 1} {{\rm{BT}}_{(m,n)}^7} } }} $ | (4) |
| $ i_0=\operatorname{int}(i / 2), j_0=\operatorname{int}(j / 2) $ | (5) |
式中:LST为陆表温度,(i, j)代表空间降尺度所得2 km空间分辨率陆表温度初步结果中第i行、第j列所在的像元;(i0, j0)代表降尺度前4 km空间分辨率陆表温度的第i0行、第j0列所在的像元;int表示取整运算,BT(i, j)7代表FY-4A AGRI第7通道像元(i, j)的亮温,ΔLST(i0, j0)代表像元(i0, j0) FY-4A AGRI陆表温度降尺度初步结果与原始陆表温度的差值,LST(i0, j0)tdu代表像元(i0, j0)初步降尺度后所得陆表温度升尺度之后的结果,LST(i0, j0)ori代表像元(i0, j0)原始FY-4A AGRI陆表温度,p(i, j)代表像元(i, j)亮温占相邻四个像元亮温总和的比例,LST(i, j)td、LST(i, j)sd分别代表像元(i, j)初步降尺度和进一步优化后的结果。
2.2 云下陆表温度重构模型的建立DINEOF法是由Beckers and Rixen(2003)提出的一种基于经验正交函数分解法EOF来重构时空场中缺失点的方法,具有无需先验值、自适应、效率高的优点。DINEOF法已经在海表温度、叶绿素a浓度、海面风场数据的重构应用中发挥了重要作用(Alvera-Azcárate et al, 2007; 窦文洁等,2015;郭海峡等,2016),在陆地要素云下重构方面,Zhou et al(2017)将其应用于青藏高原阿里地区的陆表温度重构。值得注意的是,在白天,当有云遮挡时,由于太阳辐射的急剧下降,陆表温度应会呈现出明显的下降,而这种下降主要受土地覆被类型的影响,因此,本文在DINEOF重构出的陆表温度基础上增加了基于LU的二次订正, 以提高重构精度。
DINEOF法的基本原理与工作流程可参考相关文献(Beckers and Rixen, 2003; Alvera-Azcárate et al, 2005)。通常,白天有云覆盖时,到达地表面的辐射值减小,陆表温度也随之降低,云覆盖前陆表温度越高,云覆盖后陆表温度的变化幅度就越大;不同地表类型的云下陆表温度在单位时间内发生的温度值的单位变化量所需辐射值的变化量,与云覆盖前温度高低呈线性关系(王斐等,2019)。DINEOF方法是一种时空联合插值法,云遮挡地区的重构陆表温度会参考晴空时该区域的陆表温度,因此会有一定的高估。所以,在原始DINEOF重构方法的基础上增加了基于LU数据的二次订正,其原理是,针对不同LU,统计分析原DINEOF重构值与站点实测值的Δ,然后对该LU下的重构值进行Δ订正。具体方法如下:
| $ \Delta_i=V_{\text {meas }}-V_{\mathrm{recon}, 1} $ | (6) |
| $ V_{\text {recon }, 2}=V_{\text {recon }, 1}+\Delta_i $ | (7) |
式中:Vmeas代表第i类土地覆被下遥感数据缺失点处的站点实测值,Vrecon, 1代表DINEOF方法重构值,Δi代表重构误差,Vrecon, 2代表缺失点处二次订正后的值。
3 试验与验证 3.1 静止气象卫星FY-4A AGRI陆表温度空间降尺度本文选取2022年北京冬季奥林匹克运动会(冬奥会)和冬季残疾人奥林匹克运动会(冬残奥会)主要赛场所在的北京市和河北省张家口市所在地区的静止气象卫星遥感数据FY-4A AGRI陆表温度,进行空间降尺度处理,该数据获取于2019年2月16日,星下点空间分辨率为4 km。
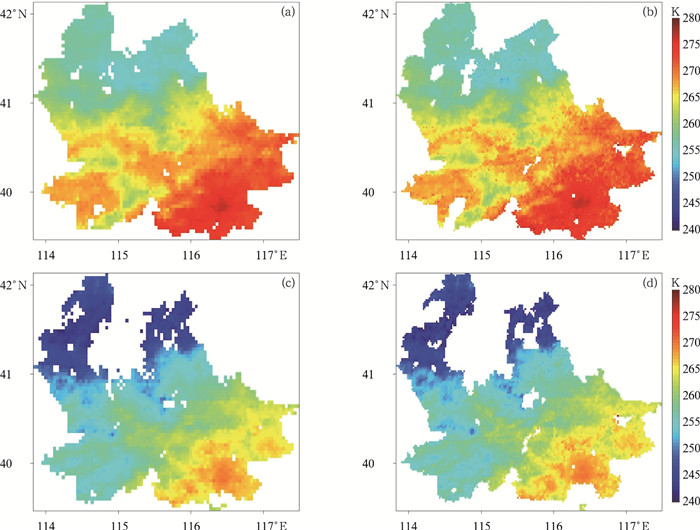
图 1a~1d分别显示了09时和14时(世界时,下同)所对应的原始FY-4A AGRI陆表温度及降尺度陆表温度经优化后的结果,图中蓝色到红色显示了陆表温度由低到高的变化。对比不同时刻降尺度前后的结果可以看出,降尺度后的陆表温度不仅由于空间分辨率的提升更好地显示了局地陆表温度的变化细节,而且较好地保持了降尺度前陆表温度的空间分布特征和变化趋势。
|
图 1 2019年2月16日(a, b)09时,(c, d)14时FY-4A AGRI陆表温度(a, c)降尺度前和(b, d)降尺度后空间分布 Fig. 1 FY-4A AGRI LST (a, c) before and (b, d) after spatial downscaling at (a, b) 09 UTC, (c, d) 14 UTC 16 February 2019 |
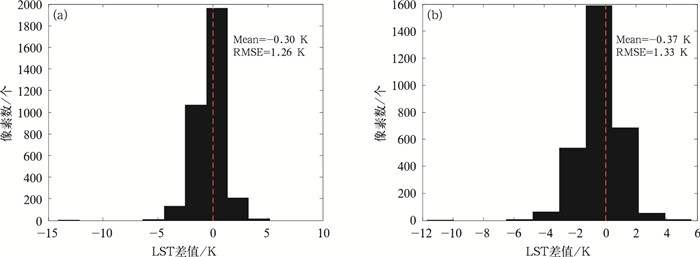
图 2显示了图 1对应时刻降尺度后陆表温度与降尺度前陆表温度的差值直方图,可以看出,09时(图 2a)和14时(图 2b)两者差值的均值(Mean)分别为-0.30 K和-0.37 K,而均方根误差(RMSE)分别为1.26 K和1.33 K,说明降尺度结果总体比降尺度前略偏低,但可以较好地保持降尺度前陆表温度的精确度。
|
图 2 2019年2月16日(a)09时和(b)14时FY-4A AGRI陆表温度降尺度前后差值直方图 Fig. 2 Histogram of FY-4A AGRI LST difference before and after spatial downscaling at (a) 09 UTC and (b) 14 UTC 16 February 2019 |
图 3显示了2019年2月16日00—14时降尺度后陆表温度与降尺度前陆表温度的差值的均值和均方根误差变化情况,可以看出,两者差值的均值和均方根误差均是随时间变化的,尤其在00—08时,而且均值均小于0 K,均值最小为-0.43 K;均方根误差最大为1.35 K,最小为0.77 K。这也说明不同时刻降尺度后结果较降尺度前偏小,但总体精确度差别不大的特点。

|
图 3 2019年2月16日00—14时FY-4A AGRI陆表温度降尺度前后差值的(a)均值和(b)均方根误差 Fig. 3 (a) Mean and (b) RMSE of FY-4A AGRI LST difference before and after spatial downscaling during 00-14 UTC 16 February 2019 |
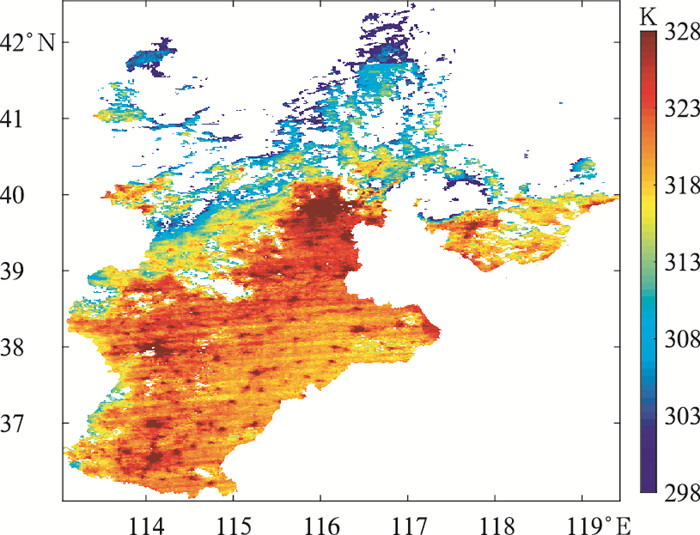
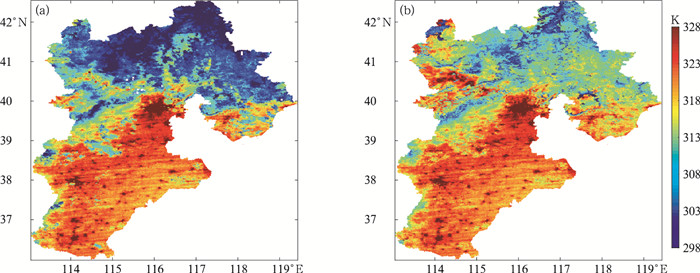
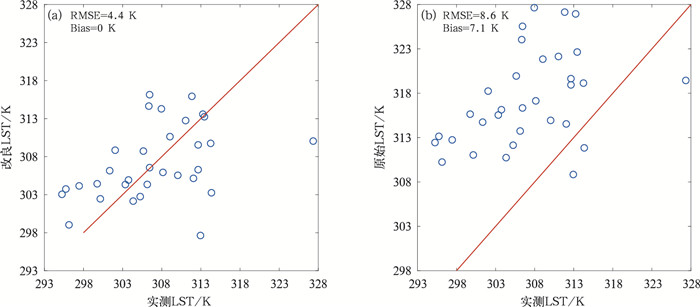
本文以2021年夏季8月数据为例(高温),选择研究区为北京—河北地区,极轨气象卫星遥感数据来源于FY-3D MERSI 250 m空间分辨率的陆表温度产品。由图 4可见,在8月1日,河北西北部和东北部地区受云层遮挡,陆表温度数据缺失比较严重,我们分别利用DINEOF原始重构方法与基于LU改良后方法进行了云下缺失数据重构,得到全天候陆表温度数据(图 5)。图 5a为改良后的重构结果,图 5b为原方法的重构结果。通过对比可以发现,原重构方法重构出的陆表温度值较大,明显高于河北北部中间部分晴空区的陆表温度,这与云层遮挡导致陆表温度下降的实际不符。对比改良后的重构结果发现,重构的陆表温度值有明显的下降,北部重构的温度甚至低于中间部分晴空区的陆表温度,这与实际比较相符。为了检验改良方法对精度的提升,分别做了2种方法重构后的云下陆表温度与云下站点的实测陆表温度对比散点图(图 6)。由图 6可见,经过LU的“二次订正”后,RMSE具有明显降低(RMSE=4.4 K),偏差(Bias)趋近于0 K(主要是因为地面站点参与订正),而原始的重构方法(图 6b)RMSE较大(RMSE=8.6 K),有明显的Bias(Bias=7.1 K)。通过对比可知,改良方法对精度的提升具有较明显的作用。
|
图 4 2021年8月1日北京—河北地区晴空陆表温度遥感 Fig. 4 FY-3D MERSI clear-sky LST in Beijing and Hebei on 1 August 2021 |
|
图 5 2021年8月1日重构后的北京—河北全天候陆表温度 (a)改良方法,(b)原始方法 Fig. 5 Reconstructed all sky LST in Beijing and Hebei on 1 August 2021 (a) result from improved algorithm, (b) result from original algorithm |
|
图 6 2021年8月1日重构的云下陆表温度与站点实测陆表温度对比 (a)改良方法, (b)原始方法 Fig. 6 The scatter plot between the reconstructed LST and in situ LST on 1 August 2021 (a) result from improved algorithm, (b) result from original algorithm |
本文发展了静止气象卫星陆表温度空间分辨率降尺度算法以及极轨气象卫星红外陆表温度云下重构算法,并用于2022年北京冬奥会和冬残奥会主要赛场所在的北京市和河北省所在地区的静止气象卫星遥感数据FY-4A AGRI陆表温度和极轨气象卫星遥感数据FY-3D MERSI陆表温度,提高了静止气象卫星陆表温度观测的空间分辨率,弥补了极轨气象卫星热红外遥感陆表温度云下缺失的不足,主要结论如下:
(1) 基于新一代静止气象卫星高时频和多光谱观测的优势,本文发展了高时频陆表温度的空间降尺度方法。基于同一卫星同一遥感器所监测的陆表温度和相关通道亮温的日变化特征,同时考虑下垫面类型的影响,应用于FY-4A AGRI陆表温度的空间降尺度,将其空间分辨率从4 km降到2 km,为区域天气、生态和环境监测等提供有力的数据和方法支持。
(2) 本文发展了基于DINEOF模型与LU二次订正的云下陆表温度重构方法,并用于极轨气象卫星FY-3D MERSI陆表温度的云下陆表温度重构,从而得到全天候的遥感陆表温度,为天气、气候等相关监测与服务提供技术和数据保障。
窦文洁, 周斌, 蒋锦刚, 等, 2015. 基于等纬度DINEOF的遥感SST产品缺失数据重构算法及精度验证分析[J]. 浙江大学学报(理学版), 42(2): 212-219. Dou W J, Zhou B, Jiang J G, et al, 2015. Data reconstruction algorithm of remote sensing SST products and accuracy analysis based on the same latitude DINEOF[J]. J Zhejiang Univ (Sci Ed), 42(2): 212-219 (in Chinese).
|
杜文涛, 秦翔, 孙维君, 等, 2011. 山地冰川区气温重建比较研究——以祁连山老虎沟冰川区为例[J]. 干旱区资源与环境, 25(10): 149-154. Du W T, Qin X, Sun W J, et al, 2011. Reconstruction of air temperature at glacier area in mountain-a case of Laohugou glacier area[J]. J Arid Land Resour Environ, 25(10): 149-154 (in Chinese). DOI:10.13448/j.cnki.jalre.2011.10.027
|
段四波. 2016. 高空间分辨率全天候地表温度反演方法研究[D]. 北京: 中国农业科学院. Duan S B. 2016. Methodology development for retrieval of all-weather land surface temperature at high spatial resolution [D]. Beijing: Chinese Academy of Agricultural Science(in Chinese).
|
郭海峡, 蔡榕硕, 谭红建, 2016. 基于DINEOF方法重构台湾海峡叶绿素a遥感缺失数据的初步研究[J]. 应用海洋学学报, 35(4): 550-558. Guo H X, Cai R S, Tan H J, 2016. A preliminary study on missing remote sensing data of chlorophyll-a in Taiwan Strait and reconstruction by DINEOF method[J]. J Appl Oceanogr, 35(4): 550-558 (in Chinese). DOI:10.3969/J.ISSN.2095-4972.2016.04.013
|
华俊玮, 祝善友, 张桂欣, 2018. 基于随机森林算法的地表温度降尺度研究[J]. 自然资源遥感, 30(1): 78-86. Hua J W, Zhu S Y, Zhang G X, 2018. Downscaling land surface temperature based on random forest algorithm[J]. Remote Sens Land Resour, 30(1): 78-86 (in Chinese).
|
李小军, 江涛, 辛晓洲, 等, 2016. 基于MODIS的地表温度空间降尺度方法[J]. 生态学杂志, 35(12): 3443-3450. Li X J, Jiang T, Xin X Z, et al, 2016. Spatial downscaling of land surface temperature based on MODIS data[J]. Chin J Ecol, 35(12): 3443-3450 (in Chinese). DOI:10.13292/j.1000-4890.201612.025
|
刘梅, 覃志豪, 涂丽丽, 等, 2011. 利用NDVI估算云覆盖地区的植被表面温度研究[J]. 遥感技术与应用, 26(5): 689-697. Liu M, Qin Z H, Tu L L, et al, 2011. Study on estimation of vegetation surface temperature in cloudy region by NDVI[J]. Remote Sens Technol Appl, 26(5): 689-697 (in Chinese).
|
闵敏, 吴晓, 2020. 从FY-4A卫星遥感数据和GFS资料估算全天空状况下的地表长波辐射通量[J]. 气象, 46(3): 336-345. Min M, Wu X, 2020. Estimating surface longwave radiation flux under all sky condition from FY-4A and GFS data[J]. Meteor Mon, 46(3): 336-345 (in Chinese).
|
聂建亮, 武建军, 杨曦, 等, 2011. 基于地表温度-植被指数关系的地表温度降尺度方法研究[J]. 生态学报, 31(17): 4961-4969. Nie J L, Wu J J, Yang X, et al, 2011. Downscaling land surface temperature based on relationship between surface temperature and vegetation index[J]. Acta Ecol Sin, 31(17): 4961-4969 (in Chinese).
|
全金玲, 占文凤, 陈云浩, 等, 2013. 遥感地表温度降尺度方法比较——性能对比及适应性评价[J]. 遥感学报, 17(2): 374-387. Quan J L, Zhan W F, Chen Y H, et al, 2013. Downscaling remotely sensed land surface temperatures: a comparison of typical methods[J]. J Remote Sens, 17(2): 374-387 (in Chinese).
|
宋庆利, 陈渭民, 周学军, 等, 2005. 利用卫星资料研究云对地面净辐射的影响[J]. 气象, 31(1): 29-32. Song Q L, Chen W M, Zhou X J, et al, 2005. A study of effect of cloud on net surface radiation with GMS-5 data[J]. Meteor Mon, 31(1): 29-32 (in Chinese).
|
涂丽丽, 覃志豪, 张军, 等, 2011. 基于空间内插的云下地表温度估计及精度分析[J]. 遥感信息, (4): 59-63. Tu L L, Qin Z H, Zhang J, et al, 2011. Estimation and error analysis of land surface temperature under the cloud based on spatial interpolation[J]. Remote Sens Inform, (4): 59-63 (in Chinese). DOI:10.3969/j.issn.1000-3177.2011.04.012
|
王爱辉, 杨英宝, 潘鑫, 等, 2021. 顾及时空特征的FY-4A云覆盖像元地表温度重建模型[J]. 武汉大学学报: 信息科学版, 46(6): 852-862. Wang A H, Yang Y B, Pan X, et al, 2021. Land surface temperature reconstruction model of FY-4A cloudy pixels considering spatial and temporal characteristics[J]. Geomat Inform Sci Wuhan Univ, 46(6): 852-862 (in Chinese).
|
王斐, 覃志豪, 樊伟, 等, 2019. 云下地表温度与辐射变化关系的定量分析[J]. 遥感学报, 23(6): 1113-1122. Wang F, Qin Z H, Fan W, et al, 2019. Quantitative analysis between land surface temperature and radiation covered by clouds[J]. J Remote Sens, 23(6): 1113-1122 (in Chinese).
|
汪子豪, 秦其明, 孙元亨, 等, 2018. 基于BP神经网络的地表温度空间降尺度方法[J]. 遥感技术与应用, 33(5): 793-802. Wang Z H, Qin Q M, Sun Y H, et al, 2018. Downscaling of remotely sensed land surface temperature with the BP neural network[J]. Remote Sens Technol Appl, 33(5): 793-802 (in Chinese).
|
周纪. 2010. 地表温度反演与城市热岛时间尺度模型[D]. 北京: 北京师范大学. Zhou J. 2010. Land surface temperature retrieval and temporal variations of urban heat island modeling based on remote sensing[D]. Beijing: Beijing Normal University(in Chinese).
|
Agam N, Kustas W P, Anderson M C, et al, 2007. A vegetation index based technique for spatial sharpening of thermal imagery[J]. Remote Sens Environ, 107(4): 545-558. DOI:10.1016/j.rse.2006.10.006
|
Aiazzi B, Alparone L, Baronti S, et al, 2005. Spatial resolution enhancement of ASTER thermal bands.Proceeding of SPIE Image and Signal Processing for Remote Sensing XI[M].
Brugge: Lorenzo Bruzzone: 1-10.
|
Alvera-Azcárate A, Barth A, Beckers J M, et al, 2007. Multivariate reconstruction of missing data in sea surface temperature, chlorophyll, and wind satellite fields[J]. J Geophys Res: Oceans, 112(C3): C03008.
|
Alvera-Azcárate A, Barth A, Rixen M, et al, 2005. Reconstruction of incomplete oceanographic data sets using empirical orthogonal functions: application to the Adriatic Sea surface temperature[J]. Ocean Model, 9(4): 325-346. DOI:10.1016/j.ocemod.2004.08.001
|
Beckers J M, Rixen M, 2003. EOF calculations and data filling from incomplete oceanographic datasets[J]. J Atmos Oceanic Technol, 20(12): 1839-1856. DOI:10.1175/1520-0426(2003)020<1839:ECADFF>2.0.CO;2
|
Dominguez A, Kleissl J, Luvall J C, et al, 2011. High-resolution urban thermal sharpener (HUTS)[J]. Remote Sens Environ, 115(7): 1772-1780. DOI:10.1016/j.rse.2011.03.008
|
Duan S B, Li Z L, 2016. Spatial downscaling of MODIS land surface temperatures using geographically weighted regression: case study in Northern China[J]. IEEE Trans Geosci Remote Sens, 54(11): 6458-6469. DOI:10.1109/TGRS.2016.2585198
|
Essa W, Verbeiren B, Van Der Kwast J, et al, 2012. Evaluation of the DisTrad thermal sharpening methodology for urban areas[J]. Int J Appl Earth Obs Geoinformation, 19: 163-172. DOI:10.1016/j.jag.2012.05.010
|
Eswar R, Sekhar M, Bhattacharya B K, 2016. Disaggregation of LST over India: comparative analysis of different vegetation indices[J]. Int J Remote Sens, 37(5): 1035-1054. DOI:10.1080/01431161.2016.1145363
|
Fasbender D, Tuia D, Bogaert P, et al, 2008. Support-based implementation of Bayesian data fusion for spatial enhancement: applications to ASTER thermal images[J]. IEEE Geoscience and Remote Sensing Letters, 5(4): 598-602. DOI:10.1109/LGRS.2008.2000739
|
Goovaerts P, 2000. Geostatistical approaches for incorporating elevation into the spatial interpolation of rainfall[J]. J Hydrol, 228(1/2): 113-129.
|
Inamdar A K, French A, Hook S, et al, 2008. Land surface temperature retrieval at high spatial and temporal resolutions over the southwestern United States[J]. J Geophys Res: Atmos, 113(D7): D07107.
|
Kustas W P, Norman J M, Anderson M C, et al, 2003. Estimating subpixel surface temperatures and energy fluxes from the vegetation index-radiometric temperature relationship[J]. Remote Sens Environ, 85(4): 429-440.
|
Merlin O, Duchemin B, Hagolle O, et al, 2010. Disaggregation of MODIS surface temperature over an agricultural area using a time series of Formosat-2 images[J]. Remote Sens Environ, 114(11): 2500-2512.
|
Minnis P, Harrison E F, 1984. Diurnal variability of regional cloud and clear-sky radiative parameters derived from GOES data. Part Ⅰ: analysis method[J]. J Climate Appl Meteor, 23(7): 993-1011.
|
Rodriguez-Galiano V, Pardo-Iguzquiza E, Sanchez-Castillo M, et al, 2012. Downscaling Landsat 7 ETM+ thermal imagery using land surface temperature and NDVI images[J]. Int J Appl Earth Obs Geoinformation, 18: 515-527.
|
Stathopoulou M, Cartalis C, 2009. Downscaling AVHRR land surface temperatures for improved surface urban heat island intensity estimation[J]. Remote Sens Environ, 113(12): 2592-2605.
|
Wan Z, Zhang Y, Zhang Q, et al, 2004. Quality assessment and validation of the MODIS global land surface temperature[J]. Int J Remote Sens, 25(1): 261-274.
|
Weng Q H, Fu P, Gao F, 2014. Generating daily land surface tempera- ture at Landsat resolution by fusing Landsat and MODIS data[J]. Remote Sens Environ, 145: 55-67.
|
Weng Q H, Lu D S, Schubring J, 2004. Estimation of land surface temperature- vegetation abundance relationship for urban heat island studies[J]. Remote Sens Environ, 89(4): 467-483.
|
Yang G J, Pu R L, Huang W J, et al, 2010. A novel method to estimate subpixel temperature by fusing solar-reflective and thermal-infrared remote-sensing data with an artificial neural network[J]. IEEE Trans Geosci Remote Sens, 48(4): 2170-2178.
|
Yang G J, Pu R L, Zhao C J, et al, 2011. Estimation of subpixel land surface temperature using an endmember index based technique: a case examination on ASTER and MODIS temperature products over a heterogeneous area[J]. Remote Sens Environ, 115(5): 1202-1219.
|
Yang Y B, Cao C, Pan X, et al, 2017. Downscaling land surface temperature in an arid area by using multiple remote sensing indices with random forest regression[J]. Remote Sens, 9(8): 789.
|
Zakšek K, Oštir K, 2012. Downscaling land surface temperature for urban heat island diurnal cycle analysis[J]. Remote Sens Environ, 117: 114-124.
|
Zhan W F, Chen Y H, Zhou J, et al, 2011. Sharpening thermal imageries: a generalized theoretical framework from an assimilation perspective[J]. IEEE Trans Geosci Remote Sens, 49(2): 773-789.
|
Zhou W, Peng B, Shi J, et al, 2017. Estimating high resolution daily air temperature based on remote sensing products and climate reanalysis datasets over glacierized basins: a case study in the Langtang Valley, Nepal[J]. Remote Sensing, 9(9): 959.
|
Zhu S Y, Guan H D, Millington A C, et al, 2013. Disaggregation of land surface temperature over a heterogeneous urban and surrounding suburban area: a case study in Shanghai, China[J]. Int J Remote Sens, 34(5): 1707-1723.
|
 2023, Vol. 49