2. 中国气象局大气探测重点开放实验室, 成都 610225;
3. 中国气象局气象探测中心, 北京 100081;
4. 南京信息工程大学, 南京 210044
2. CMA Key Laboratory of Atmospheric Sounding, Chengdu 610225;
3. CMA Meteorological Observation Centre, Beijing 100081;
4. Nanjing University of Information Science and Technology, Nanjing 210044
大气边界层(ABL)是指大气最底层,靠近地球表面、受地面摩擦阻力影响的大气层区域(魏浩等,2015)。地面大气边界层主要由三部分组成:对流边界层、中性边界层和稳定边界层。对流边界层又叫做对流混合层,层中存在着由向上的湍流热量通量造成的强烈垂直混合,常形成混合层(徐祥德等, 2014);中性边界层是指含有原先混合层空气的残余层,通常出现在日落前半小时,湍流在混合层中衰减形成的空气层,属于中性层;稳定边界层是夜间地表冷却导致边界层由下向上形成的逆温层。通常情况下,大气边界层的变化范围在2 km以下(Stull, 1988),随着人类活动范围的扩大,大气边界层的变化范围可达4 km或4 km以上。
大气边界层高度是大气数值模式和大气环境评价的重要物理参数之一(陈芳丽等,2021)。对天气预报的诊断分析和城市污染物的监控有相当重要的作用。通过探测边界层高度可以很好地监测雾-霾等环境污染(李岩瑛等,2022)。大气边界层高度(ABLH)通常采用无线电探空仪探测的气象要素垂直廓线,基于热力学基础的位温梯度法(Liu and Liang, 2010;师宇等,2019;刘思波等,2015)或基于探空风的风速变化(孟丹等,2019)反演得到。虽然探空数据的探测时间相对固定,数据的准确性和可靠性相对较高,但是一天只探测2~4次,时间分辨率低,很难满足大气边界层高度的应用需求。近年来,基于激光雷达、微波辐射计以及风廓线雷达等新型遥感反演大气边界层高度的方法越来越多,对推进新型遥感设备在业务中的应用, 提高中小尺度灾害监测、提升雾-霾监测技术以及分析天气发生演变过程的能力和水平有重大意义。赵玲等(2010)将微波辐射计资料和同时间段的探空资料进行对比,发现温湿资料总体趋势相近,可用于反演大气边界层高度。张歌(2015)基于MP-3000A微波辐射计资料用气块法、位温法、比湿法计算大气边界层高度并分析了北京市大气边界层特征及其对大气质量的影响。Angevine et al(1994)提出可以利用风廓线雷达信噪比峰值高度来估计对流边界层的顶部。White et al(1999)提出将梯度法应用于风廓线雷达订正后的信噪比数据中,即求出距离订正后的信噪比在各个高度上的导数,其负导数最大值所在的高度,可以认为是大气边界层高度。魏浩等(2015)将小波变换法运用到风廓线雷达距离订正后信噪比数据来确定大气边界层高度。由于光信号在大气中的传输受到水蒸气和气溶胶的影响,Eresmaa et al(2006)和沈建等(2017)提出使用气溶胶激光雷达将后向散射信号的强度与大气中气溶胶的含量和分布联系起来反演大气边界层高度。
根据上述常用反演方法可知,现有方法大多都是使用单一遥感设备观测数据反演大气边界层高度,但在不同时间段,大气边界层的发展特征不同,并且不同的天气、不同单一设备反演得到的大气边界层高度效果参差。因此本文对基于激光雷达、微波辐射计、风廓线雷达联合反演大气边界层高度的方法进行研究,并将联合反演结果与探空数据、ERA5数据提供的大气边界层高度作对比,能得到较精确的、连续的大气边界层高度。
1 数据与方法 1.1 数据利用北京国家综合气象探测试验基地(简称南郊站)提供的2021年5—8月的无线电探空仪、激光气溶胶雷达(简称激光雷达)、风廓线雷达、微波辐射计资料进行研究。表 1为利用各设备反演大气边界层高度所需要的产品数据及基本信息,其中由于无线电探空仪需要人为施放,因此有固定施放时间。6—9月为汛期,施放时间为08时、14时、20时;其余月份施放时间为08时、20时(北京时,下同)。其中使用的MWP967KV型地基微波辐射计、L波段测风雷达、激光雷达的垂直分辨率的信息如表 2所示。
|
|
表 1 反演大气边界层高度所需产品基本信息 Table 1 Basic information of products required to retrieve the altitude of atmospheric boundary layer |
|
|
表 2 微波辐射计温度廓线、风廓线雷达、激光雷达垂直分辨率 Table 2 Vertical resolution of temperature profile of microwave radiometer, wind profiler radar and lidar |
选择3000 m以下的廓线数据,以风廓线雷达数据时间分辨率为基准,将每2分钟一条微波辐射计数据和每1分钟一条激光雷达数据处理为每6分钟一条数据,对应每条数据代表 6分钟内所测数据的平均值,用于反演边界层高度。选取欧洲中期天气预报中心(ECMWF)所提供的ERA5(Hersbach et al, 2020)大气边界层高度再分析资料(39.8°N、116.47°E),与探空数据反演所得大气边界层高度共同作为联合反演大气边界层高度的参考标准。该资料提供的大气边界层高度时间分辨率为1 h,对应北京时间的整点时刻。为了与ERA5资料匹配,将得到的每6分钟一条的边界层高度,按整点时刻抽取为1小时一条,与ERA5资料所提供的整点时刻的边界层高度一一对应,作为全天候大气边界层高度进行分析。
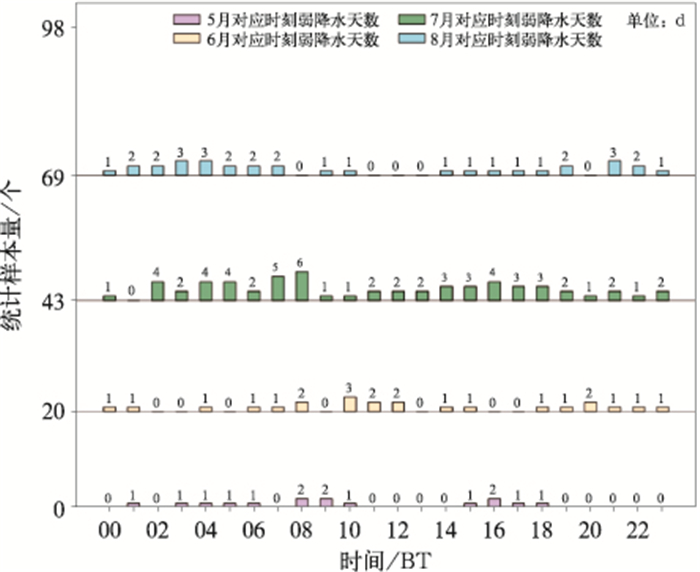
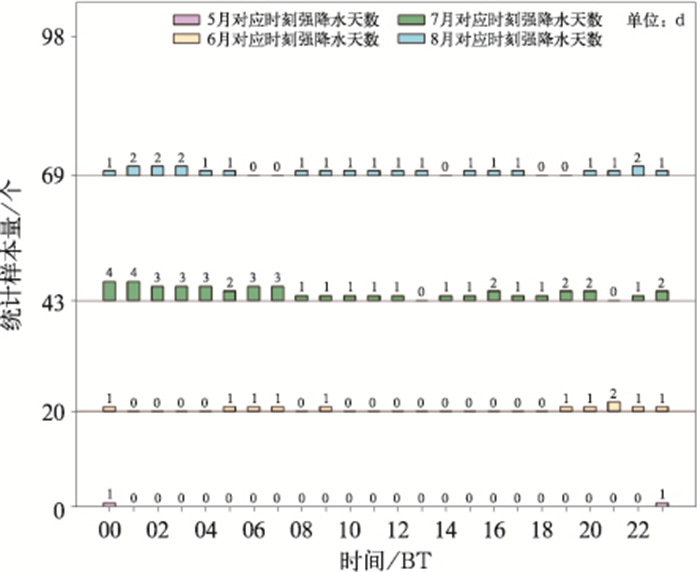
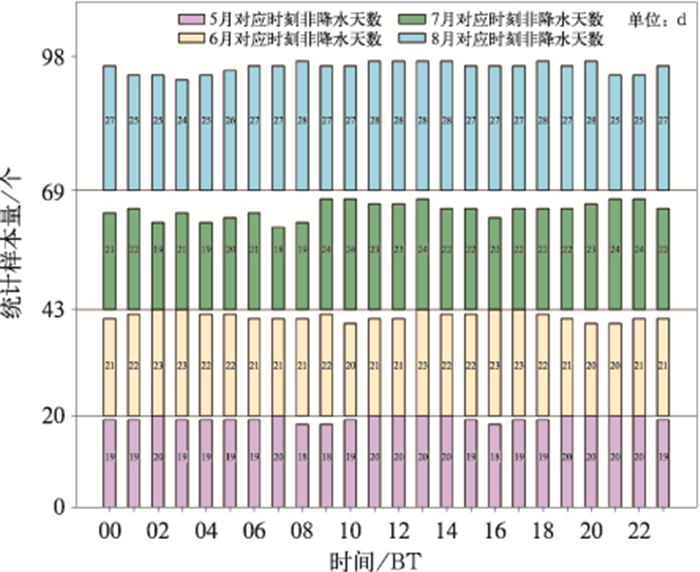
1.2 数据质量控制由于使用的微波辐射计通过探测氧气密度分布可得到温度廓线,风廓线雷达波长较长,弱降水对其影响较小,而激光雷达受弱降水影响较大,因此联合反演时,首先区分是否发生降水,较强降水时反演结果不可信。在统计分析边界层高度变化规律时,针对每个时段,使用南郊站测得的小时降雨量数据,以中国气象局给出的12 h降雨等级分化表作为标准(科迪,1995),当12 h降雨量大于15 mm,即平均小时降雨量大于1.25 mm时,作为强降水时刻,将此时刻数据进行剔除。此外,本研究基于微波辐射计、风廓线雷达、激光雷达联合反演大气边界层高度,因此当出现某个仪器未开启观测时的数据也一并剔除。最终,剔除25 d观测设备开启不齐全的数据,获得2021年5—8月间98 d数据,按每天24小时整点时刻分为非降水、弱降水、强降水三种情况。统计数据样本结果如图 1~图 3所示,图中纵坐标0~20个统计数量表示5月可用的样本总量为20 d,20~43个统计数量表示6月可用样本总量为23 d,43~69个统计数量表示7月可用的样本总量为26 d,69~98个统计数量表示8月可用的样本总量为29 d,三幅图中色条分别表示非降水、弱降水、强降水在5—8月每个时刻对应的样本量。除去79个强降水时刻,对2273个小时观测数据样本进行分析,其中非降水时刻共2143个,弱降水时刻共130个。
|
图 1 2021年5—8月24个时刻非降水天数统计 Fig. 1 Statistical chart of 24 h non-precipitation days from May to August 2021 |
1.3 联合反演方法
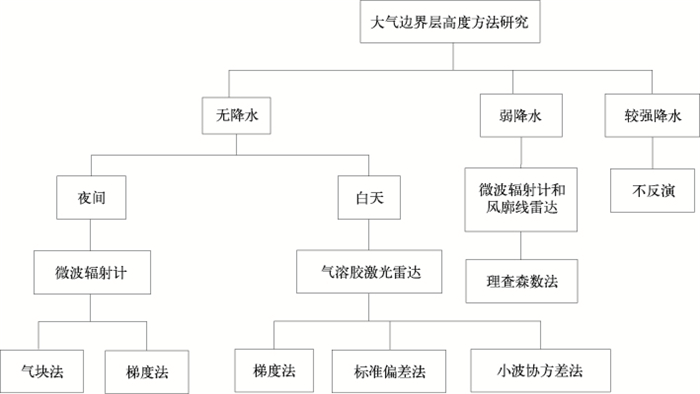
基于现有的单设备反演算法存在不足的情况,本文对激光雷达、微波辐射计、风廓线雷达三部遥感设备联合反演大气边界层高度的方法进行研究。较弱降水时采用微波辐射计和风廓线雷达联合反演的理查森数法(Melgarejo and Deardorff, 1974;Vogelezang and Holtslag, 1996);无降水时,分成白天和夜间两种情况,白天主要使用基于激光雷达的梯度法、标准偏差法、小波协方差法;夜间主要联合微波辐射计使用气块法(Emeis and Türk, 2004)、温度梯度法(Coen et al, 2014)和位温梯度法(刘超等,2017)。如图 4所示。
|
图 4 联合反演算法图 Fig. 4 Joint inversion algorithm diagram |
在弱降水时,采用微波辐射计温度廓线资料和风廓线雷达水平风资料联合反演,为了平衡降水对反演结果的影响,使用微波辐射计与风廓线雷达数据,通过理查森数法联合反演大气边界层高度。理查森数(Ri)超过临界值时的最小高度通常被认为是大气边界层高度。根据Sorensen et al(1998),离地高度z处的Ri定义为:
| $ R i(z)=\frac{g\left(z-z_0\right)}{\theta(z)} \frac{\theta(z)-\theta\left(z_0\right)}{u(z)^2+v(z)^2} $ | (1) |
式中:g是重力加速度(取10 m2·s-1或9.8 m2· s-1),z0是地面海拔高度,θ(z)代表的是在高度z时的位温,θ(z0)代表地面海拔高度对应的位温。u和v分别代表纬向和经向风分量,由风廓线雷达提供。将首次Ri/Rc>1的高度作为边界层高度,其中Rc表示临界里查森数,当Ri值达到一个临界值时的最低高度选为大气边界层高度。不同地点选取的临界值不同(Richardson et al, 2013)。经对比发现,Rc取0.25时效果最好。
在无降水时,由于夜间边界层主要受热量交换为主,湍流输送较弱,微波辐射计能获得温、湿度廓线,适用于夜间稳定边界层(Su et al, 2020);激光雷达则通过探测气溶胶的光学性质,获取大气颗粒物时空分布信息,而气溶胶积累层对应于白天的对流边界层。针对这一特性,在求取夜间稳定边界层高度时主要使用温度梯度法。温度(T)梯度计算公式如下:
| $ \mathrm{d} T / \mathrm{d} z=0 $ | (2) |
大气的温度梯度法虽然可应用于估算边界层高度,但当不存在逆温时,温度梯度法将失效,故使用位温梯度法,从地面往上位温梯度Dθ(z)最大对应的高度就定为边界层的高度,分母z为计算梯度步长,取20 m时效果较好。计算公式如下:
| $ \mathrm{D} \theta(z)=\frac{\theta_{n+1}-\theta_n}{z} $ | (3) |
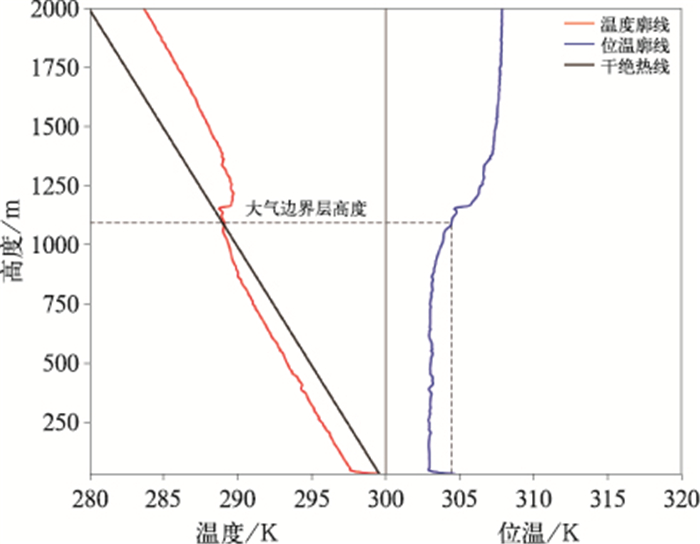
由于在夜间也会存在少数对流过程,此时使用气块法作为反演夜间边界层高度方法的补充,得到较为精确的夜间稳定边界层(图 5)。以2021年7月7日14时探空数据为例,利用气块法得到大气边界层高度。当大气以湍流混合、辐射冷却及与地面土壤间的热量交换为主时,大气中几乎没有对流作用,存在所有高度位温θ(z)均大于地表位温θ(z0)的情况,无法使用气块法判断大气边界层高度,因此将气块法用于夜间反演对流大气边界层高度的补充方法。
|
图 5 利用2021年7月7日14时探空观测到的温度廓线和位温廓线反演得到的大气边界层高度 Fig. 5 The atmospheric boundary layer heights obtained by inversion of the temperature profile and the potential temperature profile observed by radiosonde at 14:00 BT 7 July 2021 |
在求取白天对流边界层高度时,主要使用基于激光雷达的梯度法,由于标准偏差法与小波协方差法受人为因素影响较大,故这两种方法作为梯度法(He et al, 2006)的补充。当梯度法得到大气边界层高度为异常值,例如存在突变值时,使用标准偏差法(杨富燕等, 2016)与小波协方差法(Deng et al, 2014;郭宇等, 2020;Lewis et al, 2013)共同修正,订正突变值。定义后向散射信号b(z)梯度为:
| $ \mathrm{D} b(z)=\frac{\mathrm{d} b(z)}{\mathrm{d} z} $ | (4) |
根据边界层特质,b(z)为后向散射系数衰减最快的高度,即Db(z)取得最小值的高度为边界层高度(狄慧鸽等, 2014)。
根据图 4以及上述方法使用规则,形成一套基于新型遥感设备多源数据联合反演大气边界层高度的算法。将每日分为00:00—09:00、09:00—18:00、18:00—23:59三个时段。在00:00—09:00和18:00—23:59两个时段,使用微波辐射计反演大气边界层高度,主要使用梯度法找到夜间稳定边界层高度,并将气块法作为补充,找到夜间少数对流情况的大气边界层高度;在09:00—18:00这个时段,主要使用基于激光雷达的梯度法反演大气边界层高度,将标准偏差法与小波协方差法作为补充,确保得到完整的日间大气边界层高度;在弱降水时使用微波辐射计与风廓线雷达联合反演结果作为大气边界层高度,提高弱降水时得到的大气边界层高度的准确性。
2 结果分析 2.1 联合反演大气边界层高度结果分析选取2021年5月20日、6月28日、7月7日、8月2日四个例子具体说明夜间大气边界层高度适用微波辐射计进行反演,而白天对流边界层适合使用激光雷达进行反演;在不同天气情况下,即晴天和多云天情况下,同样有效。表 3为选取四个例子的天气情况与空气质量。
|
|
表 3 2021年四个例子的对应天气情况 Table 3 Corresponding weather conditions for selected four cases in 2021 |
图 6是2021年7月7日与8月2日使用单设备反演得到的大气边界层高度,其中08时、14时、20时表示探空施放时间;“-”后面的数字代表对应时刻探空数据反演得到的边界层高度(单位:m)。从图中可以看出,使用微波辐射计反演得到的大气边界层偏低,这是由于使用微波辐射计温度廓线反演可得热力边界层高度,而日间边界层主要是对流边界层,温度廓线无法展现对流变化过程;使用激光雷达反演得到的大气边界层高度整体偏高,这是由于通过激光雷达反演得到的主要为物质边界层,对应白天气溶胶累积量较大,夜间的大气边界层也偏高。同时与08时、14时、20时探空数据测得的边界层高度、ERA5数据提供的大气边界层对比,证明夜间大气边界层高度适合使用微波辐射计进行反演,而白天对流边界层适合使用激光雷达进行反演。

|
图 6 2021年(a)7月7日和(b)8月2日南郊站使用激光雷达与微波辐射计反演大气边界层高度与探空08时、14时、20时、ERA5提供大气边界层高度对比 Fig. 6 Comparison of the atmospheric boundary layer heights inversed by lidar and microwave radiometer at Nanjiao Station on (a) 7 July and (b) 2 August 2021 and the atmospheric boundary layer heights provided by radiosonde at 08:00 BT, 14:00 BT and 20:00 BT and ERA5 |
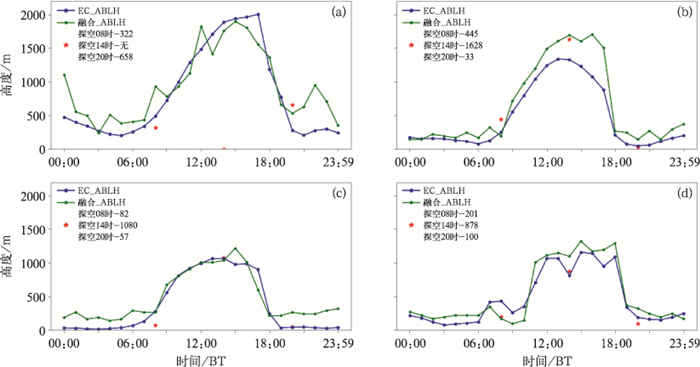
图 7为四个例子联合反演结果与ERA5数据、探空数据对比结果图,从图 7a, 7b中可以看出在多云天与晴天但空气质量良好的情况下,北京南郊站大气边界层的变化范围主要在200~2000 m左右。图 7c, 7d空气质量良好时,大气边界层受污染影响,得到大气边界层偏低,变化范围在30~1000 m变化,并且受轻度污染影响,边界层日变化规律有所衰减,但仍然满足夜间较低,多为稳定边界层,日间多为发展的对流边界层,最高大气边界层出现在午后14—16时这一日变化规律。
|
图 7 2021年南郊站四个例子联合反演大气边界层高度与探空数据、ERA5大气边界层高度对比(a)5月20日,(b)8月2日,(c)7月7日,(d)6月28日 Fig. 7 Comparison results of the boundary layer heights reversed jointly by the four cases of Nanjiao Station, the sounding data and the ERA5 atmospheric boundary layer height on (a) 20 May, (b) 2 August, (c) 7 July and (d) 28 June 2021 |
挑选2021年5月20日08时、20时;6月28日、7月7日、8月2日08时、14时、20时反演结果,将联合反演得到边界层高度、EAR5提供的边界层高度分别与探空反演得到的大气边界层高度对比,结果如表 4所示,联合反演算法比探空反演结果差值平均结果高124 m,ERA5数据结果比探空反演结果差值平均结果低20 m。联合反演算法结果与探空反演结果差值的标准偏差为215 m,ERA5结果与探空反演结果差值的标准偏差为201 m,与探空反演结果相比,两者都可以表征当前大气边界层高度结果。
|
|
表 4 2021年四个例子联合反演算法、ERA5、探空反演的大气边界层高度结果对比 Table 4 Comparison of the boundary layer heights reversed by joint inversion algorithm, ERA5, and sounding inversion results by the four cases in 2021 |
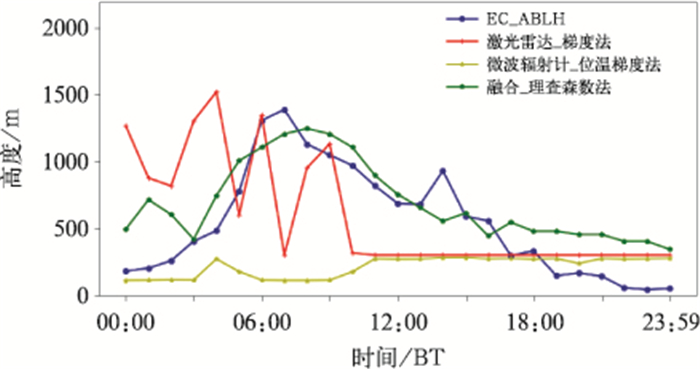
选取2021年7月12日,除01—02时为较强降水情况(此时数据质量较差,不作为分析时段),分析其余时刻为弱降水的情况(空气质量为优)。图 8展示了将经过质量控制后的微波辐射计与风廓线雷达数据使用理查森数法联合反演(绿线)、ERA5提供(蓝线)、单独使用激光雷达梯度法反演(红线)、单独使用微波辐射计位温法反演(黄线)得到的大气边界层高度对结果进行对比,弱降水时受水汽影响,微波辐射计与激光雷达衰减严重,直接使用它们得到的大气边界层高度误差较大。使用经过质量控制后的微波辐射计与风廓线雷达基于理查森数法联合反演得到的结果较原有方法有了改进。
|
图 8 2021年7月12日南郊站弱降水时联合算法反演、ERA5提供、激光雷达反演、微波辐射计反演大气边界层高度对比 Fig. 8 Comparison of the boundary layer heights obtained from the joint inversion algorithm, provided by ERA5, and retrieved by lidar and microwave radiometer respectively during the light rainfall period on 12 July 2021 |
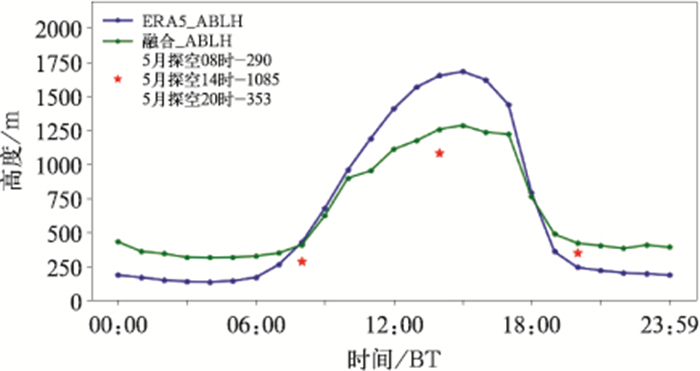
使用2021年5—8月的探空数据反演得到的大气边界层高度、ERA5再分析资料提供的大气边界层高度的平均值来描述大气边界层的日变化特征。以此来验证地基遥感设备联合反演算法的有效性。图 9是2021年5—8月的ERA5数据、探空数据反演得到08时、14时、20时大气边界层高度以及联合反演得到的大气边界层高度的平均日变化。选取08时、14时、20时联合反演结果、探空数据反演结果、ERA5结果对比看出,08时联合反演结果比探空反演结果高95 m,14时联合反演结果比探空反演结果高169 m,20时联合反演结果比探空反演结果高46 m,总体标准偏差为62 m。ERA5数据提供的大气边界层高度与探空反演结果相比,08时比探空反演结果高136 m,14时比探空反演结果高564 m,20时比探空反演结果低110 m,总体标准偏差为254 m。联合反演大气边界层结果与探空反演结果相关度较高,因此,联合边界层算法得到的结果更能体现南郊站的大气边界层变化情况。
|
图 9 2021年5—8月南郊站联合反演边界层算法与探空、ERA5提供大气边界层高度日变化对比 Fig. 9 Comparison between the joint inversion algorithm of Nanjiao Station and the daily variation of atmospheric boundary layer heights provided by radiosonde and ERA5 from May to August 2021 |
图 10为2021年5—8月每个月联合算法反演与探空数据得到大气边界层高度的变化情况。从图 10可以看出5月、6月晴天较多,近地面温度较高,向上的湍流热量通量造成的强烈垂直混合,使边界层高度被抬升,在中午时段边界层平均高度接近2 km,最大高度出现在14时和15时,分别为1725 m和1545 m。7月、8月为汛期,降水与多云天气占据大部分时间,7月晴天大概有1~2 d,8月晴天大概有2~3 d,导致了这两个月日间大气边界层高度与5月、6月相比较低,最大高度仅分别为872 m和1301 m,但也同样满足最大高度出现在14时与15时,符合边界层日变化规律。并且5—7月联合算法反演与探空数据得到的大气边界层高度一致性较好,8月得到的边界层高度受降水影响,与探空数据得到的大气边界层相比偏差较大,但仍然保持大气边界层的日变化规律。
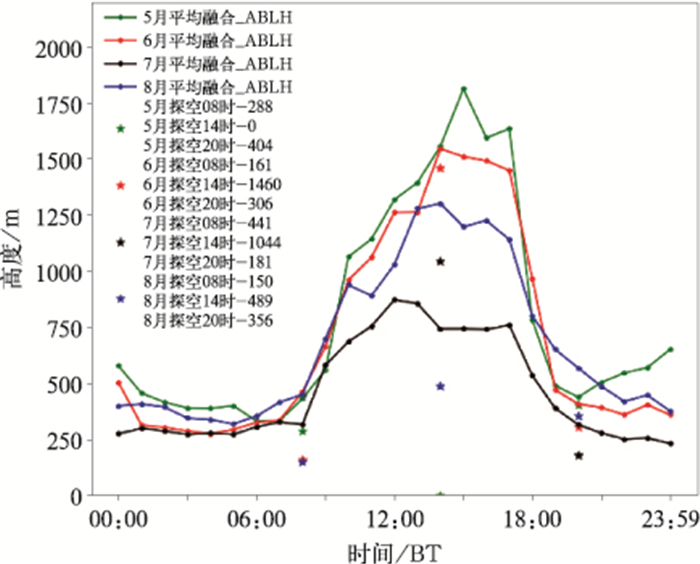
|
图 10 2021年5—8月南郊站联合算法反演与探空得到的大气边界层高度平均日变化结果对比 Fig. 10 Comparison of the average daily changes of atmospheric boundary layer heights provided by the joint inversion algorithm of Najiao Station and the radiosonde from May to August 2021 |
利用北京南郊2021年5—8月激光雷达、微波辐射计、风廓线雷达数据和探空数据,针对不同天气条件以及一天内不同时间段下各个地基遥感设备反演的边界层高度的差异,研究多源数据联合反演大气边界层的方法,并与ERA5再分析数据提供的结果进行了对比,分析了不同天气情况、边界层不同发展状况下,不同设备对边界层高度的影响。得到以下结论:
(1) 通过比较2021年5—8月的联合反演大气边界层高度平均值、ERA5提供的大气边界层高度平均值、探空08时、14时、20时三个时刻的大气边界层高度平均值,可以看出,联合反演边界层高度与探空数据、ERA5数据提供的大气边界层高度有较好的一致性,且符合边界层的日变化规律。
(2) 由于边界层的发展白天与夜晚不同,各设备反演大气边界层高度准确性也有所不同。一般情况下,激光气溶胶雷达适用于白天对流边界层的观测,微波辐射计适用于夜间稳定边界层的观测。
(3) 针对弱降水天气,提出基于微波辐射计与风廓线雷达使用理查森数法联合反演得到大气边界层高度,对比使用激光雷达、微波辐射计单独反演大气边界层高度结果有所改善。
(4) ERA5提供大气边界层高度与探空数据反演结果差值的标准偏差为254 m;联合反演结果与探空数据反演结果差值的标准偏差为62 m。相较于ERA5数据提供的一定范围内大气边界层高度均值,本文研究的联合反演边界层高度能更精准地反映更小范围内的大气边界层高度。
陈芳丽, 姜帅, 李明华, 等, 2021. 边界层急流在粤东暴雨中心两次极端强降水过程中的作用[J]. 气象, 47(3): 290-302. Chen F L, Jiang S, Li M H, et al, 2021. The of role of boundary layer jet in two severe rainfalls over eastern region of Guangdong Province[J]. Meteor Mon, 47(3): 290-302 (in Chinese).
|
狄慧鸽, 侯晓龙, 赵虎, 等, 2014. 多波长激光雷达探测多种天气气溶胶光学特性与分析[J]. 物理学报, 63(24): 244206. Di H G, Hou X L, Zhao H, et al, 2014. Detections and analyses of aerosol optical properties under different weather conditions using multi-wavelength Mie lidar[J]. Acta Phys Sin, 63(24): 244206 (in Chinese). DOI:10.7498/aps.63.244206
|
Hersbach H, Bell B, Berrisford P, 等, 2020. ERA5全球再分析产品[J]. 气象科技进展, 10(4): 160. Hersbach H, Bell B, Berrisford P, et al, 2020. The ERA5 global reanalysis[J]. Adv Meteor Sci Technol, 10(4): 160 (in Chinese).
|
郭宇, 黄兴友, 陈浩君, 2020. 风廓线雷达和微波辐射计资料反演边界层高度方法的比较[J]. 中国科技论文, 15(5): 556-562. Guo Y, Huang X Y, Chen H J, 2020. Comparison of the boundary layer height retrieval methods using wind profile radar and microwave radiometer data[J]. China Sci, 15(5): 556-562 (in Chinese). DOI:10.3969/j.issn.2095-2783.2020.05.011
|
科迪, 1995. 降雨强度标准划分[J]. 北京水利, (4): 49. Cody, 1995. Standard division of rainfall intensity[J]. Beijing Water Resour, (4): 49 (in Chinese).
|
李岩瑛, 张春燕, 张爱萍, 等, 2022. 河西走廊春季沙尘暴大气边界层垂直结构特征[J]. 气象, 48(9): 1171-1185. Li Y Y, Zhang C Y, Zhang A P, et al, 2022. Vertical structure characteristics of atmospheric boundary layer in spring sandstorm over Hexi Corridor[J]. Meteor Mon, 48(9): 1171-1185 (in Chinese).
|
刘超, 花丛, 张恒德, 等, 2017. L波段探空雷达秒数据在污染天气边界层分析中的应用[J]. 气象, 43(5): 591-597. Liu C, Hua C, Zhang H D, et al, 2017. Application of L-band radar sounding data in analyzing polluted weather boundary layer[J]. Meteor Mon, 43(5): 591-597 (in Chinese).
|
刘思波, 何文英, 刘红燕, 等, 2015. 地基微波辐射计探测大气边界层高度方法[J]. 应用气象学报, 26(5): 626-635. Liu S B, He W Y, Liu H Y, et al, 2015. Retrieval of atmospheric boundary layer height from ground-based microwave radiometer measurements[J]. J Appl Meteor Sci, 26(5): 626-635 (in Chinese).
|
孟丹, 陈正洪, 陈城, 等, 2019. 基于探空风资料的大气边界层不同高度风速变化研究[J]. 气象, 45(12): 1756-1761. Meng D, Chen Z H, Chen C, et al, 2019. Research on wind changes at different heights in atmospheric boundary layer based on sounding wind data[J]. Meteor Mon, 45(12): 1756-1761 (in Chinese). DOI:10.7519/j.issn.1000-0526.2019.12.013
|
沈建, 沈利洪, 韩笑, 等, 2017. 激光雷达与微波辐射计联合观测大气边界层高度变化[J]. 气象科技, 45(3): 425-429. Shen J, Shen L H, Han X, et al, 2017. Combined observation of boundary layer using lidar and microwave radiometer in Suzhou[J]. Meteor Sci Technol, 45(3): 425-429 (in Chinese).
|
师宇, 胡非, 丁伟宸, 等, 2019. 气溶胶激光雷达和无线电探空观测边界层高度的对比分析[J]. 气候与环境研究, 24(5): 650-662. Shi Y, Hu F, Ding W C, et al, 2019. Comparitive analysis of planetary-boundary-layer height based on aerosol lidar and radiosonde[J]. Climatic Environ Res, 24(5): 650-662 (in Chinese).
|
魏浩, 胡明宝, 艾未华, 2015. 小波变换在风廓线雷达探测大气边界层高度中的应用研究[J]. 热带气象学报, 31(6): 811-820. Wei H, Hu M B, Ai W H, 2015. The detection of the atmospheric boundary layer height using wind profiler in wavelet transform method[J]. J Trop Meteor, 31(6): 811-820 (in Chinese).
|
徐祥德, 王寅钧, 赵天良, 等, 2014. 高原东南缘大气近地层湍能特征与边界层动力、热力结构相关特征[J]. 气象, 40(10): 1165-1173. Xu X D, Wang Y J, Zhao T L, et al, 2014. Relationship between turbulent energy in the near-surface layer and atmospheric boundary layer thermodynamic structure over the southeastern side of Tibetan Plateau[J]. Meteor Mon, 40(10): 1165-1173 (in Chinese).
|
杨富燕, 张宁, 朱莲芳, 等, 2016. 基于激光雷达和微波辐射计观测确定混合层高度方法的比较[J]. 高原气象, 35(4): 1102-1111. Yang F Y, Zhang N, Zhu L F, et al, 2016. Comparison of the mixing layer height determination methods using lidar and microwave radiometer[J]. Plateau Meteor, 35(4): 1102-1111 (in Chinese).
|
张歌, 2015. 基于微波辐射观测的大气边界层结构特征及其对大气质量的影响研究[D]. 济南: 山东师范大学. Zhang G, 2015. Analysis of the atmospheric boundary layer structure based on a microwave radiation technique and its influence on air quality[D]. Jinan: Shandong Normal University(in Chinese).
|
赵玲, 马玉芬, 张广兴, 等, 2010. 地基35通道微波辐射计观测资料的初步分析[J]. 沙漠与绿洲气象, 4(1): 56-58. Zhao L, Ma Y F, Zhang G X, et al, 2010. Analysis of measuring outcomes from ground-based 35-channel microwave radiometer[J]. Desert Oasis Meteor, 4(1): 56-58 (in Chinese).
|
Angevine W M, White A B, Avery S K, 1994. Boundary-layer depth and entrainment zone characterization with a boundary-layer profiler[J]. Bound-Layer Meteor, 68(4): 375-385.
|
Coen M C, Praz C, Haefele A, et al, 2014. Determination and climatology of the planetary boundary layer height above the Swiss Plateau by in situ and remote sensing measurements as well as by the COSMO-2 model[J]. Atmos Chem Phys, 14(23): 13205-13221.
|
Deng T, Wu D, Deng X J, et al, 2014. A vertical sounding of severe haze process in Guangzhou Area[J]. Sci China Earth Sci, 57(11): 2650-2656.
|
Emeis S, Türk M, 2004. Frequency distributions of the mixing height over an urban area from Sodar data[J]. Meteor Zeits, 13(5): 361-367.
|
Eresmaa N, Karppinen A, Joffre S M, et al, 2006. Mixing height determination by ceilometer[J]. Atmos Chem Phys, 6(6): 1485-1493.
|
He Q S, Mao J T, Chen J Y, 2006. Observational and modeling studies of urban atmospheric boundary-layer height and its evolution mechanisms[J]. Atmos Environ, 40(6): 1064-1077.
|
Lewis J R, Welton E J, Molod A M, et al, 2013. Improved boundary layer depth retrievals from MPLNET[J]. J Geophys Res, 118(17): 9870-9879.
|
Liu S Y, Liang X Z, 2010. Observed diurnal cycle climatology of planetary boundary layer height[J]. J Climate, 23(21): 5790-5809.
|
Melgarejo J W, Deardorff J W, 1974. Stability functions for the boundary-layer resistance laws based upon observed boundary-layer heights[J]. J Atmos Sci, 31(5): 1324-1333.
|
Richardson H, Basu S, Holtslag A A M, 2013. Improving stable boundary-layer height estimation using a stability-dependent critical bulk richardson number[J]. Bound-Layer Meteor, 148(1): 93-109.
|
Sorensen J H, Rasmussen A, Ellermann T, et al, 1998. Mesoscale influence on long-range transport-evidence from ETEX modelling and observations[J]. Atmos Enviro, 32(24): 4207-4217.
|
Stull R B, 1988. An Introduction to Boundary Layer Meteorology[M].
Boston: Kluwer Academic Publishers.
|
Su T N, Li Z Q, Kahn R, 2020. A new method to retrieve the diurnal variability of planetary boundary layer height from lidar under different thermodynamic stability conditions[J]. Remote Sens Environ, 237: 111519.
|
Vogelezang D H P, Holtslag A A M, 1996. Evaluation and model impacts of alternative boundary-layer height formulations[J]. Bound-Layer Meteor, 81(3/4): 245-269.
|
White A B, Senff C J, Banta R M, 1999. A comparison of mixing depths observed by ground-based wind profilers and an airborne lidar[J]. J Atmos Ocean Tech, 16(5): 584-590.
|
 2023, Vol. 49

