2. 中国科学院大气物理研究所大气科学与地球流体力学数值模拟国家重点实验室,北京 100029;
3. 中国人民解放军94755部队,福建漳州 363000
2. State Key Laboratory of Numerical Modeling for Atmospheric Sciences and Geophysical Fluid Dynamics (LASG), Institute of Atmospheric Physics, Chinese Academy of Sciences, Beijing 100029;
3. Unit No.94755 of PLA, Fujian, Zhangzhou 363000
冬季中国受东亚冬季风的影响,盛行偏北风,冬季降水量相比夏季明显偏少(Li and Ma, 2012; 姚世博等, 2017)。但是,中国冬季的降水异常仍能对农业生产、国民经济和人民安全产生重要的影响,特别是冬季持续性的雨雪天气,例如2008年冰冻雨雪灾害(陶诗言和卫捷, 2008; Zhou et al, 2009; Wu et al, 2011)和2009年大范围雨雪天气(Jia and Liang, 2013),这两次异常降水事件都造成了数以亿计的经济损失和几千万人受灾。鉴于中国南方在农业、水资源管理和防灾减灾方面面临的挑战,近年来冬季降水的变化已经引起了社会和国家的广泛关注。
许多研究揭示中国冬季降水受许多因素的影响。在年际尺度上,中国冬季降水主要受El Niño-Southern Oscillation(ENSO)、东亚冬季风和北极涛动等的影响(金祖辉和陶诗言, 1999; 王林和冯娟, 2011; 袁媛等, 2014)。在El Niño(La Niña)冬季,中国南方位于西北太平洋异常反气旋(气旋)的西北侧,盛行西南风(东北风),有利于(不利于)水汽向中国南方的输送,从而导致降水相比常年偏多(偏少)(Wang et al, 2000; Li and Ma, 2012;袁良和何金海, 2013)。在弱的东亚冬季风年,中国南方对流层低层盛行西南风,有利于西太平洋的水汽向南方输送,导致中国南方的冬季降水是正异常(Zhou and Wu, 2010; Ge et al, 2016)。而在强的东亚冬季风年,南方地区低层盛行东北风,不利于水汽的输送,造成冬季南方地区的降水偏少。杨辉和李崇银(2008)研究了冬季北极涛动的影响,发现当北极涛动异常强时,中高纬为异常反气旋环流,副热带为异常气旋环流,南方地区主要受偏南气流控制,出现降水正异常。
在季节内尺度上,Madden-Julian Oscillation(MJO)对中国冬季降水有着重要影响(Jia et al, 2011; 冯俊阳和肖子牛,2012; 吴俊杰等, 2009; 吴捷等, 2018)。MJO是热带大气季节内变化的最主要的信号,它是大尺度东传的热带对流(Madden and Julian, 1971; 1972;李崇银等, 2014; 2016)。MJO一般从热带印度洋生成,然后缓慢东传至中太平洋附近消亡,其东传的周期约为30~90 d(Madden and Julian, 1994; Zhang, 2013)。由于中国的降水主要集中在夏季,以往大部分的研究都关注于MJO与中国夏季降水的关系(林爱兰等, 2013; 李永华等, 2016; 沈雨等, 2016; 郝立生等, 2021; 纪忠萍等, 2021)。而相比夏季,冬季的MJO活动更强,对中国降水的影响更显著。
随着MJO系统性东传的演变,中国东南地区的降水经历了长江流域多雨、整个南方多雨、华南多雨而长江流域少雨的演变过程(刘冬晴和杨修群, 2010; Chen et al, 2020)。MJO的位置、强度和演变都能对中国降水产生不同的影响(牛法宝等, 2013; 何洁琳等, 2019)。许多研究分析了MJO不同位置对中国降水的影响,发现当冬季MJO位于印度洋时,中国东南地区的降水显著增加,而当MJO活跃于西太平洋时,中国东南地区的降水显著减少(Jia et al, 2011)。并且MJO分别位于印度洋和西太平洋引起东南地区的降水差异能达到3~4 mm·d-1,这个值相当于冬季气候态的降水(Jeong et al, 2008)。通过对季节内降水使用EOF分解,Yao et al(2015)指出主导中国冬季降水的主要两个模态分别与MJO的第3位相和第5位相有着紧密的联系。MJO对冬季持续性强降水也有一定的调制作用,当MJO对流活跃于印度洋地区时,其引发的水汽通量异常造成华南持续性强降水增加;而当MJO对流活跃于西太平洋时,长江流域持续性强降水显示出正异常(Liu and Hsu, 2019)。MJO主要通过两种方式来影响中高纬度的天气气候。第一,与MJO相关的热带对流通过局地动力机制直接影响热带外的环流(Hong and Li, 2009; Zhang et al, 2009)。第二,MJO能够作为热带非绝热加热源来激发Rossby波列来间接调节中高纬的环流,当Rossby波列传播到中高纬度时,它能够调节中高纬度环流,进而来影响热带外的天气气候(Matthews et al, 2004; Song and Wu, 2019; Zheng and Chang, 2019;崔静等,2021)。从2019年2月初开始,中国南方地区出现了持续约一个半月的降水异常,尤其是从2月中旬到3月上旬(图 1)。导致如此长时间的降水异常的原因是什么?Wang et al(2020)研究发现高纬准定常波的出现和西太平洋副热带高压的发展,是导致长江流域持续性降水事件发生的主要原因。图 1展示了2019年2月1日至3月15日中国南方地区逐日降水和低频降水,明显可以看到南方地区的降水呈季节内特征,低频降水出现两个波峰,这表明大气季节内振荡可能存在一定的作用。本文将围绕此次南方持续性降水异常的成因及其与大气季节内振荡的关系展开研究。

|
图 1 2019年2月1日至3月15日的中国南方地区(22°~30°N、110°~122°E)平均的逐日降水(柱状)和低频降水强度(曲线, 7 d滑动平均) Fig. 1 Averaged daily precipitation (bar) and low-frequency precipitation (curve, 7 d moving average) over the southern China (22°-30°N, 110°-122°E) from 1 February to 15 March 2019 |
本文所用的资料主要有:欧洲中期预报中心(European Centre for Mediem-Range Weather Forecasts, ECMWF)1979年1月1日至2019年8月31日逐日的再分析资料(ERA-Interim;Dee et al, 2011),包括风场、位势高度场和比湿场,水平分辨率为1.5°×1.5°,垂直方向为1 000~200 hPa,共23层;美国国家海洋和大气管理局(National Oceanic and Atmospheric Research, NOAA) 1979年1月1日至2019年8月31日逐日的向外长波辐射资料(outgoing longwave radiation, OLR; Liebmann and Smith, 1996),水平分辨率为2.5°×2.5°。降水资料是由NOAA气候预测中心(Climate Prediction Center, CPC) 提供的降水数据(Xie et al, 2007),分辨率为0.5°×0.5°。澳大利亚气象局提供的逐日多变量MJO指数(RMM指数;Wheeler and Hendon, 2004),该指数使用15°S~15°N平均的OLR,850 hPa和200 hPa上纬向风的多变量联合经验正交分解得到,可实时反映MJO活动强度和位置的变化。文中所有数据的异常值都通过去除其气候态和线性趋势得到,为了滤去天气尺度扰动,进一步对异常值做了7 d滑动平均。各物理量中季节内(30~90 d)信号使用Lanczos带通滤波器获得(Duchon, 1979)。
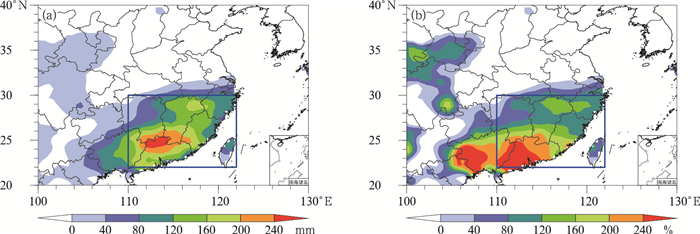
2 持续性降水特征分析图 2是2019年2月14日至3月10日中国南方地区的累计降水异常和降水距平百分率(降水距平相对于气候态降水的百分比)。可以看到,此次持续性降水异常主要集中在华南地区和长江中下游地区(图 2a),最强的降水异常出现在广东北部,超过240 mm。此外,江西东北部也存在一个降水异常超过160 mm的大值中心(图 2a)。降水距平百分率和降水异常的空间分布比较类似,主要集中在长江中下游地区和华南地区,降水距平百分率平均达到80%以上,也就是说比常年同期降水多出80%以上。广西和广东等地甚至达到了200%,表明这些地区降水量是常年同期的3倍以上(图 2b)。图 3给出了多年2月14日至3月10日的累计降水异常和强降水日数(降水大于1倍标准差的降水日)。可以看到,2019年是中国南方降水近40年来同期降水正异常最强、强降水日数最多的年份。
|
图 2 2019年2月14日至3月10日累计降水异常(a)和降水距平百分率(b) (矩形框为南方地区:22°~30°N、110°~122°E,下同) Fig. 2 Accumulated anomalous precipitation (a) and percentage of precipitation anomaly (b) from 14 February to 10 March 2019 (Rectangle represents southern China: 22°-30°N, 110°-122°E, the same below) |

|
图 3 1979—2019年2月14日至3月10日南方地区的累计降水异常(a)和强降水日数(b) Fig. 3 Accumulated anomalous precipitation (a) and the days of severe precipitation (b) over southern China from 14 February to 10 March of 1979-2019 |
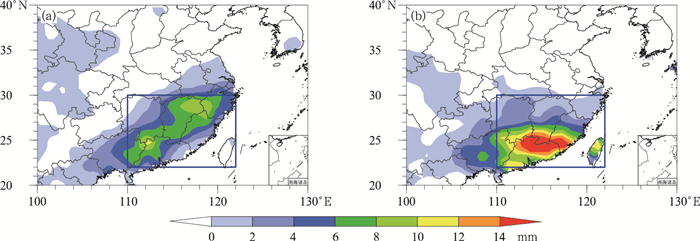
根据低频降水的两个波峰,此次持续性降水事件可以分为两个阶段,即2月14—24日(第一阶段)和2月26日至3月10日(第二阶段)。图 4给出了两个阶段合成的降水异常。可以看到两个阶段降水异常的强度和范围有一定的差异,第一阶段降水异常几乎覆盖整个南方地区;第二阶段降水异常主要集中于华南地区,且降水强度比第一阶段更强。
|
图 4 第一阶段(2019年2月14—24日,下同)(a)和第二阶段(2019年2月26日至3月10日,下同)(b)合成的降水异常 Fig. 4 Composite anomalous precipitation during the first (from 14 to 24 February 2019, the same below) (a) and second (from 26 February to 10 March 2019, the same below) (b) episodes |
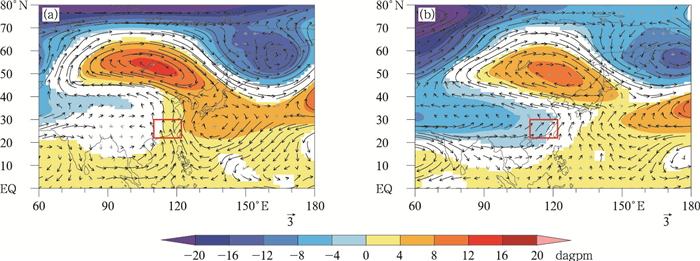
图 5是两个阶段合成的500 hPa异常水平环流和位势高度。从图中可以看到,在两个阶段中,中国大陆至贝加尔湖地区都呈现出北高南低的异常形态,在贝加尔湖地区上空有位势高度正异常和反气旋式环流。在第一阶段中,我国南方地区西侧出现弱的位势高度负异常,而西北太平洋出现位势高度正异常,呈现出西低东高的位势高度异常,有利于中国东部地区异常偏南气流的出现(图 5a)。而在第二阶段中,整个南方地区及其以西都是明显较强的位势高度负异常,且位势高度的东西梯度更大,这导致偏南气流和向北的水汽输送更强。
|
图 5 第一阶段(a)和第二阶段(b)合成的500 hPa上异常水平环流(矢量,单位:m·s-1)和位势高度(填色) (黑色箭头和填色分别表示通过0.10显著性水平检验的风场和位势高度) Fig. 5 Composite anomalous horizontal circulation (vector, unit: m·s-1) and geopotential height (colored) at 500 hPa during the first (a) and second (b) episodes (Black arrow and colored shadow indicate the wind field and geopotential height having passed the 0.10 significance test, respectively) |
图 6给出了两个阶段合成的850 hPa上异常水平环流和散度。可以看到,在第一阶段,中国南方地区对流层低层是显著的气旋式环流异常,而西北太平洋有异常的反气旋环流,从而导致中国南方地区出现较强的西南气流和水平辐合(图 6a)。这种低层异常水平环流和辐合有利于整个南方地区出现较强的异常上升运动(图 7a),这和降水主要集中在南方地区是一致的。在第二阶段,异常气旋式环流东移,中国南方地区对流层低层处于异常气旋式环流的南部,异常气流在华南辐合,而在江淮流域辐散(图 6b)。相比第一阶段,第二阶段在华南地区出现很强的上升运动(图 7b),华南地区低层的异常气流辐合与中层异常强垂直速度相结合,导致华南地区出现比第一阶段更强的降水。

|
图 6 第一阶段(a)和第二阶段(b)合成的850 hPa异常水平环流(矢量,单位:m·s-1)和散度(填色) (黑色箭头和打点分别表示通过0.10显著性水平检验的风场和散度) Fig. 6 Composite anomalous horizontal circulation (vector, unit: m·s-1) and divergence (colored) at 850 hPa during the first (a) and second (b) episodes (Black arrows and stippling indicate the wind field and divergence having passed the 0.10 significance test, respectively) |

|
图 7 第一阶段(a)和第二阶段(b)合成的500 hPa异常垂直速度(打点表示通过0.10显著性水平检验) Fig. 7 Composite anomalous vertical velocity at 500 hPa during the first (a) and second (b) episodes (Stippling indicates the result having passed the 0.10 significance test) |
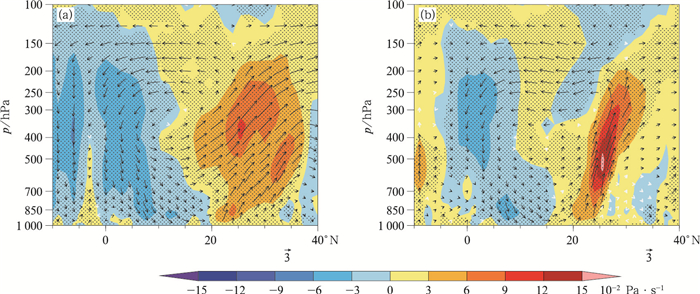
图 8是两个阶段110°~122°E平均的经圈环流和垂直运动。在第一阶段,20°~35°N有大范围的异常上升运动,而在热带赤道地区出现异常下沉运动,形成了一个局地的异常经圈环流,这种环流有利于整个南方地区出现降水增强。而在第二阶段,异常的上升运动主要出现在28°N以南,并且上升运动的强度明显比第一阶段要强,导致第二阶段的降水主要集中在华南地区,相应的降水强度也更强。水平环流和垂直环流的分析表明两个阶段的环流形势有着一定的差异,第一阶段的异常环流有利于整个南方地区的降水,而第二阶段的环流形势仅有利于华南地区的降水加强。
|
图 8 第一阶段(a)和第二阶段(b)合成的110°~122°E平均的异常经圈环流(矢量,垂直速度放大100倍)和垂直速度(填色) (黑色箭头和打点分别表示通过0.10显著性水平检验的垂直环流和垂直速度) Fig. 8 Composite anomalous meridional circulation (vector, vertical velocity magnified 100 times) and vertical velocity (colored) averaged over the 110°-122°E during the first (a) and second (b) episodes (Black arrow and stippling indicate the vertical circulation and vertical velocity having passed the 0.10 significance test, respectively) |
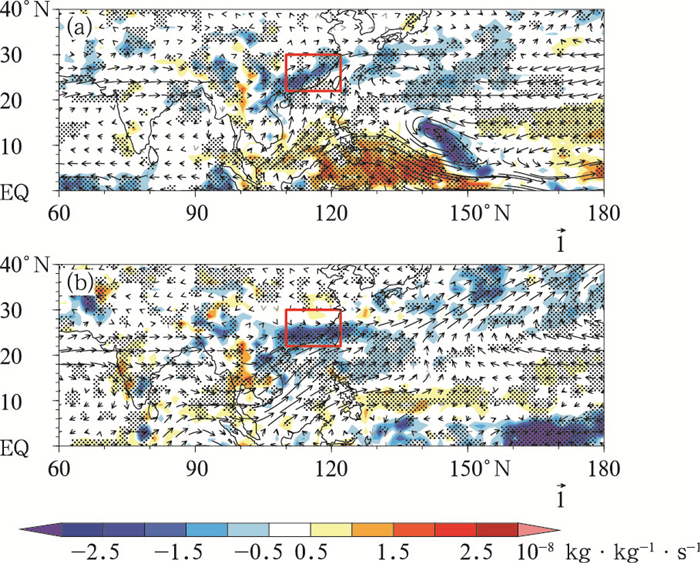
图 9给出了两个阶段合成的异常水汽通量及其散度。在第一阶段,西太平洋地区有异常的反气旋式环流,中国大陆位于反气旋式环流西侧,有较强的水汽从南海和西太平洋向北输送,在长江中下游地区和华南地区都有明显的水汽辐合(图 9a)。西北太平洋的异常反气旋在2019年2月南方持续性降水中起到重要的水汽输送作用,这和Wang et al (2020)分析的结果是一致的。而在第二阶段,西北太平洋的异常反气旋消失,中国大陆主要受西南气流的影响,有较强的水汽由孟加拉湾至南海向北输送,在华南地区有明显的水汽辐合,强度比第一阶段的水汽辐合更强,而长江中下游地区则无明显的水汽辐合(图 9b)。
|
图 9 第一阶段(a)和第二阶段(b)合成的1 000~500 hPa平均的异常水汽通量(矢量,单位:10-2 kg·kg-1·m·s-1)和水汽通量散度(填色,单位:10-8 kg·kg-1·s-1) (黑色箭头和打点分别表示通过0.10显著性水平检验的水汽通量和水汽通量散度) Fig. 9 Composite anomalous moisture flux (vector, unit: 10-2 kg·kg-1·m·s-1) and moisture flux divergence (colored, unit: 10-8 kg·kg-1·s-1) averaged over the 1 000-500 hPa region during the first (a) and second (b) episodes (Black arrows and stippling represent the moisture flux and moisture flux divergence having passed the 0.10 significance test, respectively) |
水汽通量散度主要由水汽平流和水汽散度组成:
| $ M_{\mathrm{div}}=q \frac{\partial u}{\partial x}+u \frac{\partial q}{\partial x}+q \frac{\partial v}{\partial y}+v \frac{\partial q}{\partial y} $ | (1) |
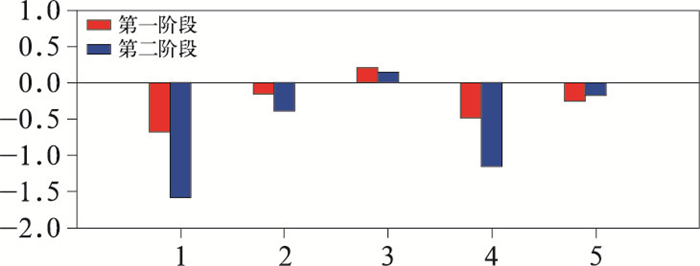
式中: q,u和v分别表示比湿、纬向风和经向风,Mdiv表示水汽通量散度。式(1)右侧从左至右分别表示的是纬向水汽辐合、纬向水汽平流、经向水汽辐合和经向水汽平流。分别对第一阶段南方地区和第二阶段华南地区的水汽通量散度诊断,发现第二阶段的水汽通量散度大约是第一阶段的两倍,这说明尽管第一阶段降水的降水范围广,但是第二阶段降水更集中,这也导致第二阶段在华南地区的降水强度远比第一阶段强(图 10)。第一阶段和第二阶段的水汽通量辐合主要都是受经向水汽辐合的控制,两个降水阶段的经向水汽辐合项对水汽通量辐合的贡献率都达到70%以上,而纬向水汽辐合项、纬向水汽平流项和经向水汽平流项对水汽通量辐合的贡献都较小。
|
图 10 第一阶段南方地区(22°~30°N、110°~122°E)和第二阶段华南地区(22°~26°N、110°~122°E)1 000~500 hPa平均的水汽通量散度各项(单位:10-8 kg·kg-1·s-1) [横坐标数字:1表示的是水汽通量散度,2~5表示的是式(1)右侧的第1~4项] Fig. 10 Composite moisture flux divergence budgets (unit: 10-8 kg·kg-1·s-1) averaged over the 1 000-500 hPa region over southern China (22°-30°N, 110°-122°E) in the first episode (red) and South China (22°-26°N, 110°-122°E) in the second episode (blue) [The 1 indicates the moisture flux divergence, and 2-5 indicate the first to fourth terms on the right side of Eq.(1)] |
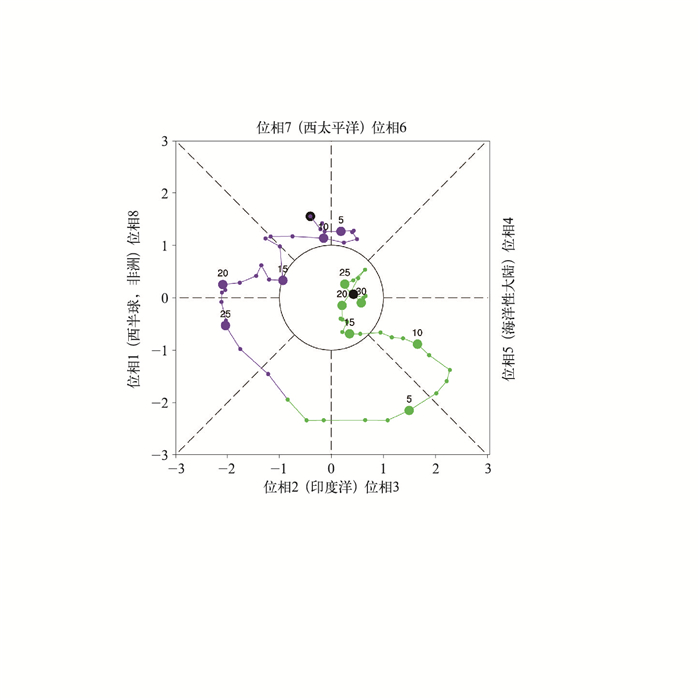
图 11给出了2019年2—3月MJO活动强度和位相分布特征。可以看到,从2月中旬到3月上旬,热带MJO位相和振幅与中国南方持续性降水有着很好的对应关系。当MJO振幅明显增强时,南方地区降水也出现明显的增强。在第一阶段,MJO活动主要位于第8和第1位相;在第二阶段,MJO活动主要位于第2~4位相。MJO活动异常可以通过影响水汽输送进而影响中国南方的降水(Chen et al, 2020),下面将通过水汽输送尺度分析来揭示MJO在此次南方持续性降水事件的作用。
|
图 11 2019年2月1日至3月31日MJO位相-强度分布 (2月为紫色,3月为绿色) Fig. 11 MJO phase-intensity diagram from 1 February to 31 March 2019 (Purple represents February and green for March) |
根据Chen et al(2020)的研究,按照时间尺度的不同可将水平风场和比湿分解为高频部分(周期小于30 d),季节内部分(周期在30~90 d)和低频部分(周期大于90 d):
| $\begin{aligned} &v=\bar{v}+v^{\prime}+v^* \\ &q=\bar{q}+q^{\prime}+q^* \end{aligned} $ | (2) |
式中:上角“-”“′”“*”分别表示的是低频部分、季节内部分和高频部分。根据之前的分析,将对水汽通量辐合贡献最大的经向水汽辐合项进一步分解为:
| $\begin{aligned} q \frac{\partial v}{\partial y}=& \bar{q} \frac{\partial \bar{v}}{\partial y}+\bar{q} \frac{\partial v^{\prime}}{\partial y}+\bar{q} \frac{\partial v^*}{\partial y}+\\ & q^{\prime} \frac{\partial \bar{v}}{\partial y}+q^{\prime} \frac{\partial v^{\prime}}{\partial y}+q^{\prime} \frac{\partial v^*}{\partial y}+\\ & q^* \frac{\partial \bar{v}}{\partial y}+q^* \frac{\partial v^{\prime}}{\partial y}+q^* \frac{\partial v^*}{\partial y} \end{aligned} $ | (3) |
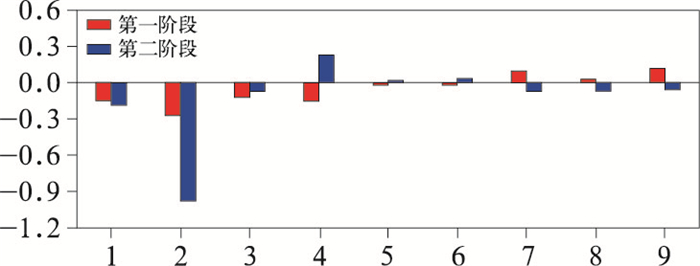
图 12给出了两个阶段中经向水汽辐合各项。结果表明,在第一阶段,高频经向风、季节内经向风和低频经向风对低频水汽的辐合以及低频经向风对季节内水汽的辐合都起到一定的作用,尤其是季节内经向风对低频水汽的辐合。而在第二阶段,低频经向风和季节内经向风对低频水汽的辐合起到最重要的作用,其他项的作用都较小。在两个阶段的经向水汽输送中,季节内经向风对低频水汽的辐合贡献都是最大,特别是在第二阶段,季节内经向风对低频水汽的辐合起到决定性作用。这表明MJO可通过调节季节内经向风对水汽的输送,从而调节中国南方的持续性降水。
|
图 12 第一阶段南方地区(22°~30°N、110°~122°E)和第二阶段华南地区(22°~26°N、110°~122°E)1 000~500 hPa平均的经向水汽辐合各项(单位:10-8 kg·kg-1·s-1) [横坐标数字:1~9表示的是式(3)右侧的第1~9项] Fig. 12 Composite meridional moisture convergences (unit: 10-8 kg·kg-1·s-1) averaged over the 1 000-500 hPa region over southern China (22°-30°N, 110°-122°E) in the first episode (red) and South China (22°-26°N, 110°-122°E) in the second episode (blue) [1-9 indicate the first to ninth terms on the right side of Eq.(3)] |
刘冬晴和杨修群(2010)、Jia et al(2011)、Chen et al(2020)研究指出通常当MJO位于第8和第1位相时,华南地区的降水异常偏少,而当MJO位于第2~5位相时,华南地区的降水都是偏多。第二阶段的降水分布与前人的研究基本一致,但是在第一阶段,MJO主要位于第8和第1位相,不仅导致长江流域的降水异常偏多,而华南地区的降水也异常偏多。那么是什么原因导致降水出现如此明显的差异呢?通过比较冬季MJO第8和第1位相气候态与第一阶段的850 hPa季节内环流异常和OLR可知,第一阶段中海洋性大陆地区出现很强的MJO对流抑制,激发了南海地区较强的南风异常,从而导致华南出现明显的水汽辐合,而气候态上的MJO对流未能在海洋性大陆激发出很强的对流抑制和南海的南风异常(图 13)。

|
图 13 第一阶段(a)和冬季MJO第8和第1位相(b)合成的850 hPa季节内环流(矢量,单位:m·s-1)和MJO OLR(填色) (黑色箭头和打点分别表示通过0.10显著性水平检验的环流和MJO OLR) Fig. 13 Composite intraseasonal circulation at 850 hPa (vector, unit: m·s-1) and MJO OLR (colored) during the first episode (a) and the MJO of the phase 8 and phase 1 in winter (b) (Black arrow and stippling represent the circulation and MJO OLR having passed the 0.10 significance test, respectively) |
2019年2月中旬到3月上旬中国南方地区出现了一次持续性降水事件,该降水事件是近40年来同期降水量最大、强降水日数最多的降水事件。根据降水的演变,此次持续性降水事件可以分为两个阶段。第一阶段降水基本上覆盖了整个中国南方地区,而第二阶段降水主要出现在华南地区,且降水强度比第一阶段更强。
大尺度环流分析表明,在此次持续性降水事件中,南亚地区都是位势高度负异常,西北太平洋地区都是位势高度正异常,导致中国南方呈现出西低东高的位势高度异常,有利于中国南方地区出现异常偏南气流和水汽向南方输送。在第一阶段,整个南方地区的对流层低层出现散度负异常,而中层出现较强的上升运动,中低层的环流配置,导致20°~35°N有大范围的异常上升运动,而在热带赤道地区出现异常下沉运动,形成了一个经向局地异常环流,这种环流有利于整个南方地区出现降水。而在第二阶段,华南地区的对流层低层出现异常辐合,江淮流域出现异常辐散,而华南地区对流层中层出现很强的上升运动,异常的上升运动主要出现在30°N以南,且上升运动的强度明显比第一阶段偏强,从而导致第二次降水的强度也更强。
通过分析两个阶段的水汽通量及其散度,发现两个阶段的水汽辐合存在明显差异,在第一阶段整个南方地区都出现明显的水汽辐合,而在第二阶段,仅在华南地区出现明显的水汽辐合,且水汽辐合的强度更强。进一步诊断南方和华南地区的水汽收支,发现引起两个阶段水汽通量散度出现异常的主要是经向水汽辐合项,其他水汽输送项对水汽通量辐合的总贡献小于30%。
这次持续性降水事件在时间尺度上属于季节内尺度的事件,而MJO作为次季节可预报性的来源可能在这次事件中起到一定的作用。通过对南方地区的降水特征分析,发现南方地区出现两次明显的低频降水,低频降水的变化和MJO位相和振幅的演变有着紧密的联系。当MJO振幅明显增强时,南方地区开始出现明显的降水,而当MJO振幅减弱时,降水迅速减少。在时间尺度上,将两个阶段中起主要贡献的经向水汽辐合项分解。结果表明,低频尺度和季节内尺度的相互作用对经向水汽辐合项起到决定性作用,尤其是季节内经向风对低频水汽的辐合。这说明MJO可通过调节季节内经向风对水汽的输送,从而影响南方地区的降水。另外,在这次南方持续性降水事件中,中高纬的异常环流也起到一定的作用,中高纬的阻塞高压不仅造成冷空气持续向南入侵,为长江—淮河流域持续一个月的降水提供有利的条件(Wang et al, 2020)。中高纬的异常环流还可以引起大气对MJO加热的不同响应, 从而调节MJO活动对南方降水产生不同的影响(Chen et al, 2021)。至于冬季中高纬的异常环流是如何引起大气对MJO加热的不同响应?我们将在下一步的工作中重点探讨,为次季节降水的预测提供更加有力的支撑。
崔静, 杨双艳, Li Tim, 2021. MJO与北半球高纬地区冬季地表气温异常的联系[J]. 气象, 47(1): 49-59. Cui J, Yang S Y, Li T, 2021. Relationship between the Madden-Julian Oscillation and high-latitude surface air temperature during boreal winter[J]. Meteor Mon, 47(1): 49-59 (in Chinese).
|
冯俊阳, 肖子牛, 2012. 热带低频振荡的强度和相位对中国南方冬季降水的影响[J]. 气象, 38(11): 1355-1366. Feng J Y, Xiao Z N, 2012. Impact of low-frequency oscillation intensity and phases in tropics on the winter precipitation in southern China[J]. Meteor Mon, 38(11): 1355-1366 (in Chinese).
|
郝立生, 马宁, 何丽烨, 等, 2021. 北半球夏季大气低频振荡演变特征及其与华北夏季降水的关系[J]. 大气科学, 45(6): 1-14. Hao L S, Ma N, He L Y, et al, 2021. Evolution characteristics of BSISO and its relationship with summer precipitation in North China[J]. Chin J Atmos Sci, 45(6): 1-14 (in Chinese).
|
何洁琳, 陆虹, 何慧, 等, 2019. 广西冬季降水的低频特征及其与MJO的联系[J]. 热带气象学报, 35(3): 304-312. He J L, Lu H, He H, et al, 2019. Low frequency characteristics of wintertime rainfall in Guangxi and its relationship with MJO[J]. J Trop Meteor, 35(3): 304-312 (in Chinese).
|
纪忠萍, 源艳芬, 徐艳虹, 等, 2021. 2019年广东前汛期连续暴雨与大气季节内振荡的联系[J]. 大气科学, 45(3): 588-604. Ji Z P, Yuan Y F, Xu Y H, et al, 2021. The relationship between continuous rainstorms and atmospheric intraseasonal oscillation during the first rainy season in Guangdong in 2019[J]. Chin J Atmos Sci, 45(3): 588-604 (in Chinese).
|
金祖辉, 陶诗言, 1999. ENSO循环与中国东部地区夏季和冬季降水关系的研究[J]. 大气科学, 23(6): 663-672. Jin Z H, Tao S Y, 1999. A study on the relationships between ENSO cycle and rainfalls during summer and winter in eastern China[J]. Chin J Atmos Sci, 23(6): 663-672 (in Chinese). DOI:10.3878/j.issn.1006-9895.1999.06.03
|
李崇银, 凌健, 宋洁, 等, 2014. 中国热带大气季节内振荡研究进展[J]. 气象学报, 72(5): 817-834. Li C Y, Ling J, Song J, et al, 2014. Research progress in China on the tropical atmospheric intraseasonal oscillation[J]. Acta Meteor Sin, 72(5): 817-834 (in Chinese).
|
李崇银, 凌健, 袁媛, 等, 2016. 大气MJO研究的几个前沿问题[J]. 热带气象学报, 32(6): 797-816. Li C Y, Ling J, Yuan Y, et al, 2016. Frontier issues in current MJO studies[J]. J Trop Meteor, 32(6): 797-816 (in Chinese).
|
李永华, 向波, 卢楚翰, 等, 2016. 热带大气季节内振荡对西南地区东部夏季降水的影响及其可能机制[J]. 大气科学, 40(2): 437-450. Li Y H, Xiang B, Lu C H, et al, 2016. Impact of Madden-Julian Oscillation activities on precipitation in summer over the east of Southwest China and its possible mechanism[J]. Chin J Atmos Sci, 40(2): 437-450 (in Chinese).
|
林爱兰, 李春晖, 谷德军, 等, 2013. 热带季节内振荡对广东6月降水的影响[J]. 热带气象学报, 29(3): 353-363. Lin A L, Li C H, Gu D J, et al, 2013. Impact of tropical intraseasonal oscillations on the precipitation of Guangdong in June[J]. J Trop Meteor, 29(3): 353-363 (in Chinese). DOI:10.3969/j.issn.1004-4965.2013.03.001
|
刘冬晴, 杨修群, 2010. 热带低频振荡影响中国东部冬季降水的机理[J]. 气象科学, 30(5): 684-693. Liu D Q, Yang X Q, 2010. Mechanism responsible for the impact of Madden-Julian Oscillation on the wintertime rainfall over eastern China[J]. J Meteor Sci, 30(5): 684-693 (in Chinese). DOI:10.3969/j.issn.1009-0827.2010.05.016
|
牛法宝, 杞明辉, 杨素雨, 等, 2013. MJO不同活动中心位置对云南冬半年降水过程的影响[J]. 气象, 39(9): 1145-1153. Niu F B, Qi M H, Yang S Y, et al, 2013. Influence of MJO center position on precipitation process of Yunnan in winter half year[J]. Meteor Mon, 39(9): 1145-1153 (in Chinese).
|
沈雨, 任宏利, 李维京, 等, 2016. 我国南方夏季低频降水与热带大气季节内振荡传播的关系研究[J]. 热带气象学报, 32(1): 31-41. Shen Y, Ren H L, Li W J, et al, 2016. Relationship between summer low-frequency rainfall over southern China and propagation of tropical intraseasonal oscillation[J]. J Trop Meteor, 32(1): 31-41 (in Chinese).
|
陶诗言, 卫捷, 2008. 2008年1月我国南方严重冰雪灾害过程分析[J]. 气候与环境研究, 13(4): 337-350. Tao S Y, Wei J, 2008. Severe snow and freezing-rain in January 2008 in the southern China[J]. Climatic Environ Res, 13(4): 337-350 (in Chinese).
|
王林, 冯娟, 2011. 我国冬季降水年际变化的主模态分析[J]. 大气科学, 35(6): 1105-1116. Wang L, Feng J, 2011. Two major modes of the wintertime precipitation over China[J]. Chin J Atmos Sci, 35(6): 1105-1116 (in Chinese).
|
吴捷, 任宏利, 许小峰, 等, 2018. MJO对我国降水影响的季节调制和动力-统计降尺度预测[J]. 气象, 44(6): 737-751. Wu J, Ren H L, Xu X F, et al, 2018. Seasonal modulation of MJO's impact on precipitation in China and its dynamical-statistical downscaling prediction[J]. Meteor Mon, 44(6): 737-751 (in Chinese).
|
吴俊杰, 袁卓建, 钱钰坤, 等, 2009. 热带季节内振荡对2008年初南方持续性冰冻雨雪天气的影响[J]. 热带气象学报, 25(S1): 103-111. Wu J J, Yuan Z J, Qian Y K, et al, 2009. The role of intraseasonal oscillation in the southern-China snow stroms during January 2008[J]. J Trop Meteor, 25(S1): 103-111 (in Chinese).
|
杨辉, 李崇银, 2008. 冬季北极涛动的影响分析[J]. 气候与环境研究, 13(4): 395-404. Yang H, Li C Y, 2008. Influence of Arctic Oscillation on temperature and precipitation in winter[J]. Climatic Environ Res, 13(4): 395-404 (in Chinese).
|
姚世博, 姜大膀, 范广洲, 2017. 中国降水的季节性[J]. 大气科学, 41(6): 1191-1203. Yao S B, Jiang D B, Fan G Z, 2017. Seasonality of precipitation over China[J]. Chin J Atmos Sci, 41(6): 1191-1203 (in Chinese).
|
袁良, 何金海, 2013. 两类ENSO对我国华南地区冬季降水的不同影响[J]. 干旱气象, 31(1): 24-31. Yuan L, He J H, 2013. Different impacts of two types of ENSO on winter rainfall over South China[J]. J Arid Meteor, 31(1): 24-31 (in Chinese).
|
袁媛, 李崇银, 杨崧, 2014. 与厄尔尼诺和拉尼娜相联系的中国南方冬季降水的年代际异常特征[J]. 气象学报, 72(2): 237-255. Yuan Y, Li C Y, Yang S, 2014. Decadal anomalies of winter precipitation over southern China in association with El Niño and La Niña[J]. Acta Meteor Sin, 72(2): 237-255 (in Chinese).
|
Chen X, Li C Y, Li X, et al, 2020. Modulation of the impacts of Madden-Julian Oscillation on winter rainfall in China by El Niño-Southern Oscillation[J]. Int J Climatol, 40(9): 4039-4052.
|
Chen X, Ling J, Li C Y, et al, 2021. Different impacts of Madden-Julian Oscillation on winter rainfall over southern China[J]. J Meteor Res, 35(2): 271-281.
|
Dee D P, Uppala S M, Simmons A J, et al, 2011. The ERA-Interim reanalysis: configuration and performance of the data assimilation system[J]. Quart J Roy Meteor Soc, 137(656): 553-597.
|
Duchon C E, 1979. Lanczos filtering in one and two dimensions[J]. J Appl Meteor, 18(8): 1016-1022.
|
Ge J W, Jia X J, Lin H, 2016. The interdecadal change of the leading mode of the winter precipitation over China[J]. Climate Dyn, 47(7-8): 2397-2411.
|
Hong C C, Li T, 2009. The extreme cold anomaly over southeast Asia in February 2008:roles of ISO and ENSO[J]. J Climate, 22(13): 3786-3801.
|
Jeong J H, Kim B M, Ho C H, et al, 2008. Systematic variation in wintertime precipitation in East Asia by MJO-induced extratropical vertical motion[J]. J Climate, 21(4): 788-801.
|
Jia X L, Chen L J, Ren F M, et al, 2011. Impacts of the MJO on winter rainfall and circulation in China[J]. Adv Atmos Sci, 28(3): 521-533.
|
Jia X L, Liang X Y, 2013. Possible impacts of Madden-Julian oscillation on the severe rain-snow weather in China during November 2009[J]. J Trop Meteor, 19(3): 233-241.
|
Li C, Ma H, 2012. Relationship between ENSO and winter rainfall over Southeast China and its decadal variability[J]. Adv Atmos Sci, 29(6): 1129-1141.
|
Liebmann B, Smith C A, 1996. Description of a complete (interpolated) outgoing longwave radiation dataset[J]. Bull Amer Meteor Soc, 77(6): 1275-1277.
|
Liu Y, Hsu P C, 2019. Long-term changes in wintertime persistent heavy rainfall over southern China contributed by the Madden-Julian Oscillation[J]. Atmos Oceanic Sci Lett, 12(5): 361-368.
|
Madden R A, Julian P R, 1971. Detection of a 40-50 day oscillation in the zonal wind in the tropical Pacific[J]. J Atmos Sci, 28(5): 702-708.
|
Madden R A, Julian P R, 1972. Description of global-scale circulation cells in the tropics with a 40-50 day period[J]. J Atmos Sci, 29(6): 1109-1123.
|
Madden R A, Julian P R, 1994. Observations of the 40-50-day trop-ical oscillation-a review[J]. Mon Wea Rev, 122(5): 814-837.
|
Matthews A J, Hoskins B J, Masutani M, 2004. The global response to tropical heating in the Madden-Julian Oscillation during the northern winter[J]. Quart J Roy Meteor Soc, 130(601): 1991-2011.
|
Song L, Wu R G, 2019. Impacts of MJO convection over the maritime continent on eastern China cold temperatures[J]. J Climate, 32(12): 3429-3449.
|
Wang B, Wu R G, Fu X H, 2000. Pacific-East Asian teleconnection: how does ENSO affect East Asian climate?[J]. J Climate, 13(9): 1517-1536.
|
Wang Z X, Sun J L, Wu J C, et al, 2020. Attribution of persistent precipitation in the Yangtze-Huaihe River Basin during February 2019[J]. Adv Atmos Sci, 37(12): 1389-1404.
|
Wheeler M C, Hendon H H, 2004. An all-season real-time multivariate MJO index: development of an index for monitoring and prediction[J]. Mon Wea Rev, 132(8): 1917-1932.
|
Wu Z W, Li J P, Jiang Z H, et al, 2011. Predictable climate dynamics of abnormal East Asian winter monsoon: once-in-a-century snowstorms in 2007/2008 winter[J]. Climate Dyn, 37(7-8): 1661-1669.
|
Xie P P, Yatagai A, Chen M Y, et al, 2007. A gauge-based analysis of daily precipitation over East Asia[J]. J Hydrometeorol, 8(3): 607-626.
|
Yao Y H, Lin H, Wu Q G, 2015. Subseasonal variability of precipitation in China during boreal winter[J]. J Climate, 28(16): 6548-6559.
|
Zhang C D, 2013. Madden-Julian oscillation: bridging weather and climate[J]. Bull Amer Meteor Soc, 94(12): 1849-1870.
|
Zhang L N, Wang B Z, Zeng Q C, 2009. Impact of the Madden-Julian Oscillation on summer rainfall in Southeast China[J]. J Climate, 22(2): 201-216.
|
Zheng C, Chang E K M, 2019. The role of MJO propagation, lifetime, and intensity on modulating the temporal evolution of the MJO extratropical response[J]. J Geophys Res: Atmos, 124(10): 5352-5378.
|
Zhou L T, Wu R G, 2010. Respective impacts of the East Asian winter monsoon and ENSO on winter rainfall in China[J]. J Geophys Res: Atmos, 115(D2): D02107.
|
Zhou W, Chan J C L, Chen W, et al, 2009. Synoptic-scale controls of persistent low temperature and icy weather over southern China in January 2008[J]. Mon Wea Rev, 137(11): 3978-3991.
|
 2022, Vol. 48
