2. 南京信息工程大学气象灾害预报预警与评估协同创新中心/气象灾害教育部重点实验室,南京 210044
2. Ministry of Education and Collaborative Innovation Center on Forecast and Evaluation of Meteorological Disasters (CIC-FEMD)/Key Laboratory of Meteorological Disaster (KLME), Nanjing University of Information Science and Technology, Nanjing 210044
2021年7月17—22日,河南省遭遇极端强降雨,郑州、新乡、开封、周口、焦作等地部分地区出现特大暴雨(累计过程降水量为250~350 mm), 郑州城区局地达500~657 mm,最大小时降水强度达到201.9 mm·h-1,已超过1975年的“75·8”特大暴雨(189.5 mm·h-1)(丁一汇,2015;孙跃等,2021),这也是全球大中城市小时降水强度的最高纪录。此次特大洪涝灾害过程造成河南数百人遇难及失踪。
受全球变暖影响,大气不稳定性增加,更多陆地地区出现极端降水事件(Li et al,2018;Qin et al,2021)。我国极端强降水量或暴雨降水量在总降水量中的比重有所增加,极端强降水或暴雨级别的降水强度也逐渐增强(Zhai et al,2005;高荣等,2018;Wu et al,2020;周璇等,2020),群发性暴雨也普遍呈增多增强趋势(张芳华等,2020;Chen et al,2021)。
已有研究表明,我国短时强降水(20~40 mm·h-1)发生频率的空间分布与暴雨(≥50 mm·d-1)相似,总体呈由东南向西北递减的趋势,主要发生在夏季,与东亚夏季风北进南撤、西太平洋副热带高压北跳南退较为一致,其日变化多峰特征明显,大部分地区短时强降水都是夜间多发,短时强降水量级一般都很大,对总降水量的贡献率远大于其发生率(陈炯等,2013;钱忠华等,2020)。毛冬艳等(2018)通过对西南地区短时强降水气候特征的分析,指出贵州东南部、四川盆地西南部和云南东南部是短时强降水高发区,其中贵州地区的短时强降水的年际变化在高发区离散度较大,在贵州西北部低发区离散度较小(肖蕾等,2021)。此外,我国东北(陈相甫和赵宇,2021)、华北(Zhong et al,2015;Li et al,2017)、长江中下游(Luo et al,2014)等地区的极端降水均具有典型的区域特征和影响系统。
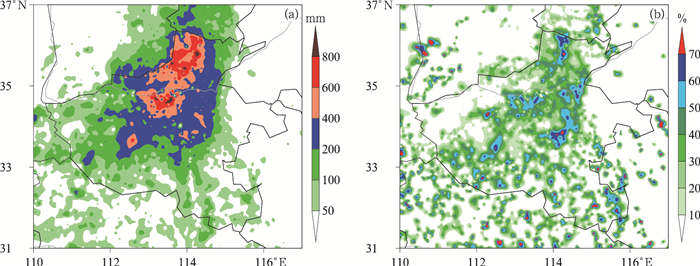
河南省位于中国中部,地处中国暖温带半湿润区与北亚热带气候过渡带中,也是黄淮西部地貌过渡区,其北邻太行山,西邻西北—东南走向的伏牛山,南部位于淮河流域上游,东部位于华北平原南缘(图 1a)。王婧羽等(2019)统计发现,河南省短时强降水集中发生在7月和8月,主要存在4个大值区,即豫北黄河以北地区、豫东商丘地区、豫西南伏牛山以南以东地区、豫南沿淮及其以南地区;地形对降水的增幅作用显著,主要通过增加短时强降水发生频次实现。近些年河南降水呈现出明显的极端化,大到暴雨对全年总降水量的贡献呈明显上升趋势,季风对其影响较大,暴雨空间分布总体上自西向东逐渐增加,南多北少,区域差异明显(鲁坦等,2017;梁钰等,2020)。

|
图 1 河南省周边(a)地形和(b)气象站点分布 Fig. 1 Distribution of (a) topography and (b) meteorological stations in Henan Province |
历史上河南发生过多次导致重大生命财产损失的极端暴雨事件(丁一汇,2015;栗晗等,2018),此次河南极端降水过程具有突发性强、生命史长、短时降水强度大、预测预报难、致灾严重等特点(冉令坤等,2021; 苏爱芳等,2022;汪小康等,2022;蔡芗宁,2022)。本文将从累计降水量、降水强度和时间演变等角度分析导致本次洪涝灾害的强降水极端性特征。
1 资料和方法本文所用资料为国家气象信息中心提供的国家气象观测站(以下简称国家站)及区域气象观测站(以下简称区域站)小时降水量,数据在使用前经过质量控制,共选取河南省内有效站点2 373个(图 1b),时段为2021年7月17日09时至23日08时(北京时,下同)。郑州国家站降水数据来自国家气象信息中心提供的1951—2021年逐日降水资料。参考俞小鼎(2013),将降水强度≥20 mm·h-1的降水定义为短时强降水。日降水量等级采用中央气象台定义标准,大雨:25~50 mm,暴雨:50~100 mm,大暴雨:100~250 mm,特大暴雨:≥250 mm。
2 累计降水量极端性特征 2.1 空间分布特征2021年7月17—22日,河南省发生的大范围暴雨过程主要集中在豫中北地区(图 2a)。统计表明,全省2 373个站6天累计降水量平均达到219.05 mm·站-1,有155个站超过600 mm,主要集中在郑州、新乡和鹤壁等地区,400~600 mm的站数达到266个,分布在平顶山、许昌、郑州、新乡、鹤壁和安阳等区域,降水量为200~400 mm的站数最多,达到556个(表 1)。全省32.5%的国土面积(5.43万km2)累计降水量大于250 mm(表 2),超过河南“75·8”特大暴雨过程的3.45万km2(丁一汇,2015)。结合地形(图 1a)发现,此次暴雨落区位于太行山东南侧、伏牛山东北侧,与王婧羽等(2019)研究结果一致,即伏牛山以东支脉的喇叭口地形区为河南强降水的高频区之一。
|
图 2 2021年7月17日09时至23日08时(a)过程累计降水量分布和(b)同期短时强降水量占总降水量的百分比 Fig. 2 Spatial distribution of (a) accumulated precipitation and (b) the ratio of flash heavy rain to total precipitation from 09:00 BT 17 to 08:00 BT 23 July 2021 |
|
|
表 1 2021年7月17日09时至23日08时河南省2 373个站累计总降水和短时强降水(括号内数字)统计 Table 1 Statistics of accumulated precipitation and flash heavy rain (number in bracket) at 2 373 stations in Henan Province from 09:00 BT 17 to 08:00 BT 23 July 2021 |
|
|
表 2 河南“21·7”和“75·8”特大暴雨情况对比 Table 2 Comparison between the "21·7" and "75·8" rainstorms in Henan Province |
将各站短时强降水量进行累计,计算同期短时强降水量及其占总降水量的百分比(贡献率)。短时强降水总量的空间分布与总降水量基本一致,大值中心分别位于郑州、新乡和鹤壁的部分地区(图略),总共有1 514个站出现至少1个时次的短时强降水,累计短时强降水量超过600 mm的站有4个(表 1)。短时强降水贡献率的大值区比较分散,除了东部的商丘和西部的三门峡之外,其他地区都有一定数量站点的短时强降水贡献率超过50%,其中郑州、鹤壁、洛阳、许昌、南阳和信阳等地区的部分站点超过70%(图 2b)。
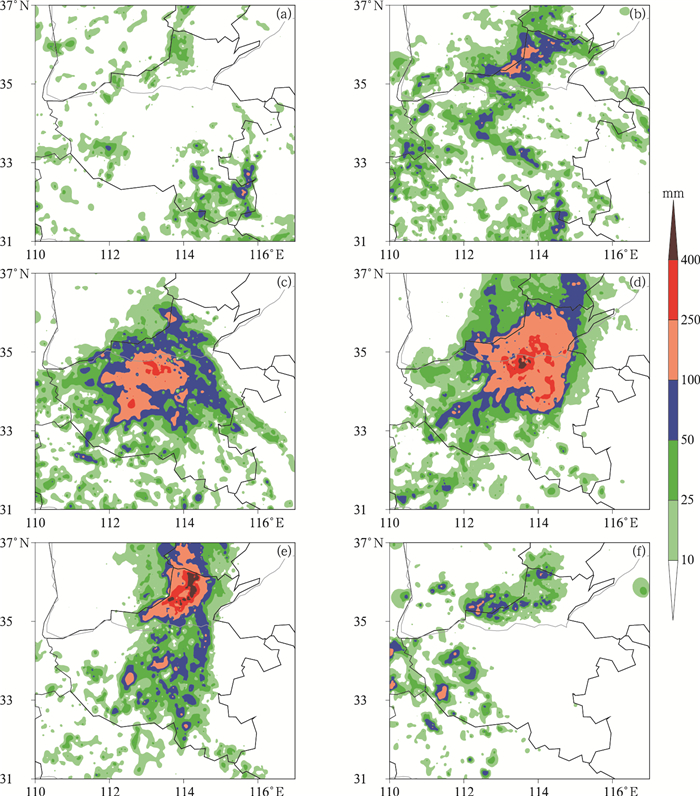
这次特大暴雨过程从7月17日上午自河南东南部开始发生,然后向北部地区扩展,23日上午基本结束,持续时间超过6天。其中,18日强降水主要位于河南中部和北部,驻马店、平顶山、新乡、鹤壁和安阳出现暴雨和大暴雨,尤其是新乡和安阳部分地区超过100 mm(图 3b)。19日和20日强降水范围迅速扩大且强度增大,250 mm以上降水落区分布在郑州、新乡、开封和平顶山地区,郑州城区平均降水量连续2天超过300 mm(图 3c,3d)。21日雨带北移,强降水范围有所减小,但强度进一步加强,集中到新乡、鹤壁和安阳三个地区,400 mm以上面积超过19日和20日(图 3e)。22—23日降水逐渐减弱,河南东北和西南部分区域超过大暴雨量级(图 3f)。
|
图 3 2021年7月17日09时至23日08时逐日降水量空间分布(a)17日,(b)18日,(c)19日,(d)20日,(e)21日,(f)22日 Fig. 3 Spatial distribution of daily precipitation from 09:00 BT 17 to 08:00 BT 23 July 2021 (a) 17 July, (b) 18 July, (c) 19 July, (d) 20 July, (e) 21 July, (f) 22 July |
上文分析表明,此次河南特大暴雨过程共持续了6天,其中7月19—21日最强,全省共有19个国家站日降水量突破有气象记录以来历史极值。对比“75·8”极端暴雨过程不同时段降水强度发现,此次过程小时降水量达到201.9 mm,出现在郑州国家站,超过“75·8”过程林庄站的189.5 mm。3 h、6 h、12 h、1 d、3 d和5 d降水强度虽然没有超过林庄站(表 2),但是200 mm以上过程降水量面积为7.52万km2,大于“75·8”过程的6.53万km2。
郑州国家站2021年7月总降水量高达902.0 mm,是绝大多数南方城市都从未有过的数据。从1951—2021年的7月郑州降水量序列来看,2021年的降水量远远大于往年,是历史第二大值(1957年,376.3 mm)的两倍多,是历史平均值(153.2 mm)的近6倍(图 4)。

|
图 4 1951—2021年郑州国家站7月降水量逐年变化 (黑线为气候平均值) Fig. 4 Variation of monthly precipitation in July from 1951 to 2021 at Zhengzhou Station (Black line indicates the climatological mean value) |
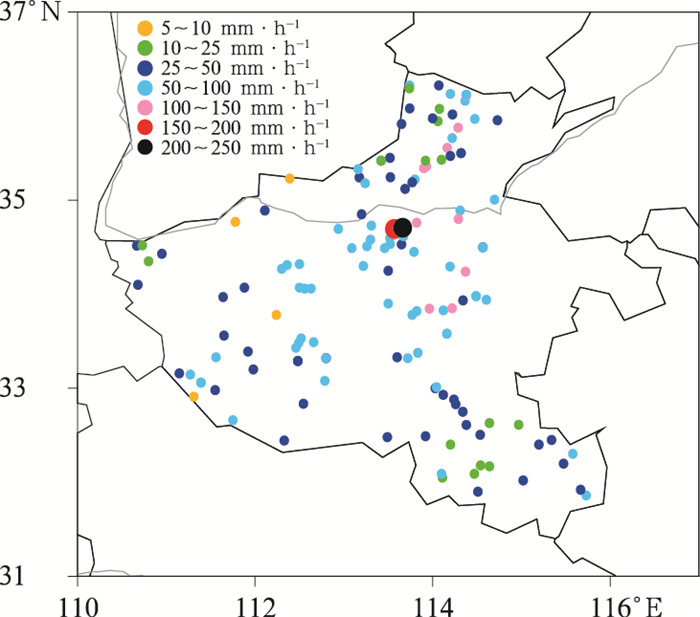
小时尺度的短历时强降水是强降水的极端特征之一。统计此次河南特大暴雨过程(144个时次)每个时次的极大值,其平均值达到56.6 mm·h-1,有73个时次的降水强度超过50 mm·h-1(表 3),最大时次降水强度出现在7月20日17时,郑州国家站降水强度为201.9 mm·h-1,第二大降水强度出现在前一时次(20日16时),为尖岗水库站的158.0 mm·h-1(图 5)。从各时次最大降水强度空间分布来看,100 mm·h-1以下降水强度的分布较为均匀,出现位置具有随机性。100 mm·h-1以上降水强度主要发生在郑州、鹤壁、新乡和开封等地,这与上文中总降水量的空间分布较为一致, 也进一步证实了此次过程极端性表现出显著的局地性特征。
|
|
表 3 2021年7月17日09时至23日08时河南省逐时(144个时次)最大降水强度量级 Table 3 Statistics of hourly maximum precipitation intensity in Henan Province from 09:00 BT 17 to 08:00 BT 23 July 2021 |
|
图 5 2021年7月17日09时至23日08时河南省逐时(144个时次)最大降水强度站点分布 Fig. 5 Spatial distribution of hourly maximum precipitation intensity in Henan Province from 09:00 BT 17 to 08:00 BT 23 July 2021 |
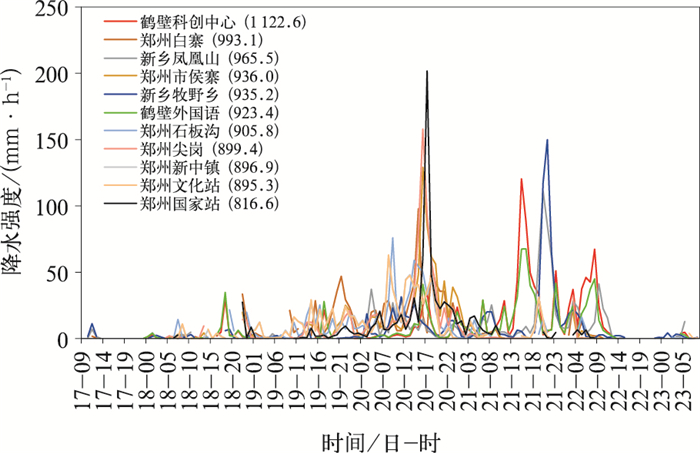
图 6给出此次过程累计降水量排名前十站点和郑州国家站的逐时降水变化。10个区域站分布在鹤壁、郑州和新乡3个地市,鹤壁2个站(科创中心和外国语学校)、郑州6个站(白寨、侯寨、石板沟、尖岗、新中镇和文化站)、新乡2个站(凤凰山和牧野乡)。排名第一的鹤壁科创中心的降水量为1 122.6 mm,排名第十的郑州文化站也达到了895.3 mm。从图 6可以看出,特大暴雨过程主要分为3个时段,即7月18日15时至19日04时、19日09时至21日08时、21日09时至22日14时。第一时段降水强度较小、持续时间较短,第二时段降水强度最大、持续时间最长,3个时段间隔时间很短,尤其是第二和第三时段基本是连续的。其中,1 h最大降水量为上文多次提到的201.9 mm(郑州国家站,20日17时),3 h和6 h最大降水量分别为333.2 mm(20日15—17时)和465.9 mm(20日14—19时),均发生在郑州尖岗水库附近。可见,这次持续性暴雨过程具有显著的局地性特征。
|
图 6 2021年7月17日09时至23日08时河南省累计降水量排名前十站点和郑州国家站的逐时降水强度 (站名后面数字表示过程累计降水量,单位:mm) Fig. 6 Hourly precipitation intensity at the top 10 stations and Zhengzhou Station from 09:00 BT 17 to 08:00 BT 23 July 2021 (The number behind the station name indicates the accumulated precipitation, unit: mm) |
本文选取降水大值区的4个典型测站,对小时降水量进行排序并计算对应累计小时降水量(图 7)。4个测站最大小时降水量都接近或超过100 mm,并且分别出现了11个时次(郑州国家站)、21个时次(鹤壁科创中心)、20个时次(郑州白寨)和12个时次(新乡凤凰山)的短时强降水(≥20 mm·h-1)。4个测站中排名前2个时次的降水量之和均超过了常年7月平均累计降水量,前21、11、18和17个时次累计降水量超过各自测站全年平均累计降水量。上述数据表明此次特大暴雨过程不仅持续时间长,降水强度的极端性也非常突出。

|
图 7 2021年7月17日09时至23日08时河南省代表站点小时降水量排序及其累计降水量(a)郑州国家站,(b)鹤壁科创中心,(c)郑州白寨,(d)新乡凤凰山 Fig. 7 The ranking of hourly precipitations and their accumulations from 09:00 BT 17 to 08:00 BT 23 July 2021 (a) Zhengzhou Station, (b) Hebi Kechuangzhongxin Station, (c) Zhengzhou Baizhai Station, (d) Xinxiang Fenghuangshan Station |
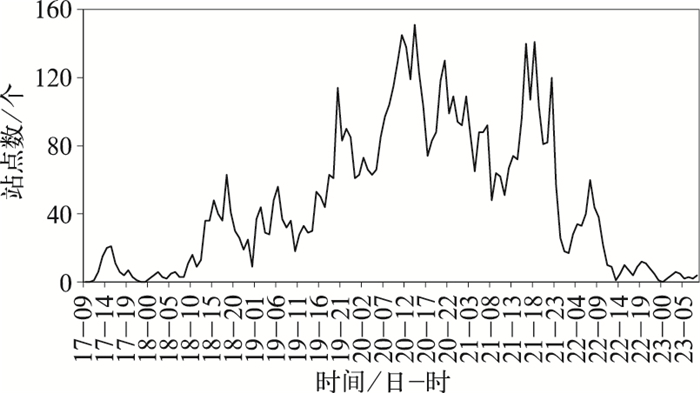
上文分析指出,总降水量前十的代表性气象站的降水变化显示暴雨过程主要经历了3个时段。进一步对河南省2 373个站的逐小时降水量进行统计,得到全省短时强降水的时间变化特征(图 8)。研究时段内144个时次共发生6 676个站次的短时强降水,平均每个时次有46.4个站。整个过程有多个短时强降水站点数峰值,最多短时强降水站点出现在20日14时,共有151个站降水强度超过20 mm·h-1。7月20日17时仅有74个站发生短时强降水,但是该时刻郑州国家站发生了201.9 mm·h-1的超强降水。
|
图 8 2021年7月17日09时至23日08时河南省发生短时强降水(≥20 mm·h-1)站点数 Fig. 8 Number of stations with flash heavy rain (≥20 mm·h-1) in Henan Province from 09:00 BT 17 to 08:00 BT 23 July 2021 |
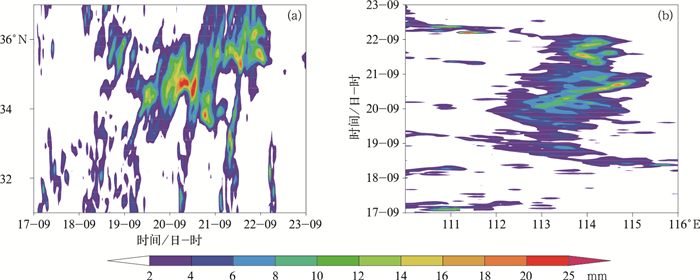
为了详细了解强降水中心的空间移动、合并等演变特征,将站点降水量插值到格点进而绘制出纬度-时间和经度-时间剖面图(图 9)。由图 9a可见,7月17日上午,河南南部和北部有零星降水,强度较小,17日下午到夜间只有南部有降水。18日上午降水面积增大,从南到北均有强降水发生,其中河南北部降水在18日下午加强,但到了19日中午又逐渐减弱消失。河南中部(34.5°N附近)的强降水从19日中午开始出现,19日夜间进一步增强,20日中午到夜间是降水最强时段,也就是在该时段郑州市区遭遇了严重洪涝灾害,降水强度突破历史极值。21日凌晨开始,强降水中心分别向南北两侧有所转移,21日中午,强降水中心北移,南部降水减弱,河南北部的新乡鹤壁等地强降水一直持续到22日下午(图 9a)。经度-时间剖面图显示(图 9b),强降水中心的东西向摆动不太明显,大范围暴雨的起止时间是从18日下午到22日下午。
|
图 9 2021年7月17日09时至23日08时逐时降水量的(a)纬度-时间(113°~114.5°E平均) 和(b)经度-时间(34°~37°N平均)剖面 Fig. 9 (a) Latitude-time (113°-114.5°E) averaged and (b) longitude-time (34°-37°N) averaged cross-section of hourly precipitation from 09:00 BT 17 to 08:00 BT 23 July 2021 |
河南“21·7”特大暴雨是继“75·8”特大暴雨之后的又一次历史罕见极端降水过程,本文主要基于河南全省2 373个站点降水数据进行统计分析,主要结论如下:
(1)“21·7”特大暴雨过程持续时间长(7月17—22日),6天累计降水量平均达到219.05 mm·站-1,有155个站超过600 mm。全省32.5%面积(5.43万km2)累计过程降水量大于250 mm,超过“75·8”过程的3.45万km2。强降水主要有3个时段(18日15时至19日04时、19日09时至21日08时、21日09时至22日14时),最大降水时段发生在19—21日,降水落区主要集中在豫中北地区,位于太行山东南侧、伏牛山东北侧。
(2) 共计1 514个站出现至少1个时次的短时强降水(≥20 mm·h-1),短时强降水总量的空间分布与总降水量基本一致,大值中心分别位于郑州、新乡和鹤壁等地。短时强降水贡献率的大值区比较分散,其中郑州、鹤壁、洛阳、许昌、南阳和信阳等地部分站点超过70%。强降水中心时空演变特征表现出南北位置的摆动,20日中午到夜间集中在河南中部,21日中午集中在河南北部,东西向摆动不明显。
(3) 此次持续性暴雨过程的极端性具有显著的局地特征,且突发性强。郑州国家站7月20日17时1 h降水量达201.9 mm,超过“75·8”过程,并打破全国国家站历史纪录。3 h和6 h最大降水量均发生在郑州尖岗水库附近。郑州国家站7月总降水量高达902.0 mm,约是近70年历史平均值的6倍。
陈炯, 郑永光, 张小玲, 等, 2013. 中国暖季短时强降水分布和日变化特征及其与中尺度对流系统日变化关系分析[J]. 气象学报, 71(3): 367-382. Chen J, Zheng Y G, Zhang X L, et al, 2013. Analysis of the climatological distribution and diurnal variations of the short-duration heavy rain and its relation with diurnal variations of the MCSs over China during the warm season[J]. Acta Meteor Sin, 71(3): 367-382 (in Chinese).
|
陈相甫, 赵宇, 2021. 冷涡背景下东北地区短时强降水统计特征[J]. 高原气象, 40(3): 510-524. Chen X F, Zhao Y, 2021. Statistical analysis on hourly heavy rainfall in Northeast China induced by cold vortices[J]. Plateau Meteor, 40(3): 510-524 (in Chinese).
|
蔡芗宁, 陈涛, 谌芸, 等, 2022. 对流层高层冷涡对"21·7"河南持续性极端暴雨影响分析[J]. 气象, 48(5): 545-555. Cai X N, Chen T, Chen Y, et al, 2022. Dynamic impact of upper tropospheric cold low on persistent extreme rainstorm of Henan during 17-22 July 2021[J]. Meteor Mon, 48(5): 545-555 (in Chinese).
|
丁一汇, 2015. 论河南"75.8"特大暴雨的研究: 回顾与评述[J]. 气象学报, 73(3): 411-424. Ding Y H, 2015. On the study of the unprecedented heavy rainfall in Henan Province during 4-8 August 1975:review and assessment[J]. Acta Meteor Sin, 73(3): 411-424 (in Chinese).
|
高荣, 宋连春, 钟海玲, 2018. 2016年汛期中国降水极端特征及与1998年对比[J]. 气象, 44(5): 699-703. Gao R, Song L C, Zhong H L, 2018. Characteristics of extreme precipitation in China during the 2016 flood season and comparison with the 1998 situation[J]. Meteor Mon, 44(5): 699-703 (in Chinese).
|
栗晗, 王新敏, 张霞, 等, 2018. 河南"7·19"豫北罕见特大暴雨降水特征及极端性分析[J]. 气象, 44(9): 1136-1147. Li H, Wang X M, Zhang X, et al, 2018. Analysis on extremity and characteristics of the 19 July 2016 severe torrential rain in the north of Henan Province[J]. Meteor Mon, 44(9): 1136-1147 (in Chinese).
|
梁钰, 乔春贵, 董俊玲, 2020. 近34年河南首场暴雨时空分布特征及环流背景分析[J]. 气象与环境科学, 43(2): 26-32. Liang Y, Qiao C G, Dong J L, 2020. Spatial-temporal distribution and impact analysis of the first rainstorm in Henan Province over the recent 34 years[J]. Meteor Environ Sci, 43(2): 26-32 (in Chinese).
|
鲁坦, 徐文明, 俞小鼎, 等, 2017. 2003—2014年河南春季暴雨特征及影响系统分析[J]. 气象与环境科学, 40(2): 92-99. Lu T, Xu W M, Yu X D, et al, 2017. Analysis of characteristics and influence systems on spring rainstorm in Henan during 2003-2014[J]. Meteor Environ Sci, 40(2): 92-99 (in Chinese).
|
毛冬艳, 曹艳察, 朱文剑, 等, 2018. 西南地区短时强降水的气候特征分析[J]. 气象, 44(8): 1042-1050. Mao D Y, Cao Y C, Zhu W J, et al, 2018. Climatic characteristics of short-time severe precipitation in Southwest China[J]. Meteor Mon, 44(8): 1042-1050 (in Chinese).
|
钱忠华, 周前进, 刘莉, 等, 2020. 中国东部雨季降水事件的静默时间特征及内在动力学机制初探[J]. 气象学报, 78(6): 914-927. Qian Z H, Zhou Q J, Liu L, et al, 2020. A preliminary study on the characteristics of quiet time and intrinsic dynamic mechanism of precipitation events in the rainy season in eastern China[J]. Acta Meteor Sin, 78(6): 914-927 (in Chinese).
|
冉令坤, 李舒文, 周玉淑, 等, 2021. 2021年河南"7.20"极端暴雨动、热力和水汽特征观测分析[J]. 大气科学, 45(6): 1-18. Ran L K, Li S W, Zhou Y S, et al, 2021. Observational analysis of the dynamic, thermal, and water vapor characteristics of the "7.20" extreme rainstorm event in Henan Province, 2021[J]. Chin J Atmos Sci, 45(6): 1-18 (in Chinese).
|
苏爱芳, 席乐, 吕晓娜, 等, 2022. 豫北"21·7"极端暴雨过程特征及成因分析[J]. 气象, 48(5): 556-570. Su A F, Xi L, Lyu X N, et al, 2022. Analysis on characteristics and causes of the July 2021 extreme rainstorm in Northern Henan[J]. Meteor Mon, 48(5): 556-570 (in Chinese).
|
孙跃, 肖辉, 杨慧玲, 等, 2021. 基于遥感数据光流场的2021年郑州"7·20"特大暴雨动力条件和水凝物输送特征分析[J]. 大气科学, 45(6): 1-16. Sun Y, Xiao H, Yang H L, et al, 2021. Analysis of dynamic conditions and hydrometeor transport of Zhengzhou superheavy rainfall event on 20 July 2021 based on optical flow field of remote sensing data[J]. Chin J Atmos Sci, 45(6): 1-16 (in Chinese).
|
王婧羽, 李哲, 汪小康, 等, 2019. 河南省雨季短时强降水时空分布特征[J]. 暴雨灾害, 38(2): 152-160. Wang J Y, Li Z, Wang X K, et al, 2019. Temporal and spatial distribution characteristics of flash heavy rain in Henan during rainy season[J]. Torr Rain Dis, 38(2): 152-160 (in Chinese). DOI:10.3969/j.issn.1004-9045.2019.02.007
|
汪小康, 崔春光, 王婧羽, 等, 2022. "21·7"河南特大暴雨水汽和急流特征诊断分析[J]. 气象, 48(5): 533-544. Wang X K, Cui C G, Wang J Y, et al, 2022. Diagnostic analysis on water vapor and jet characteristics of the July 2021 severe torrential rain in Henan Province[J]. Meteor Mon, 48(5): 533-544 (in Chinese).
|
肖蕾, 杜小玲, 武正敏, 等, 2021. 贵州省短时强降水时空分布特征分析[J]. 暴雨灾害, 40(4): 383-392. Xiao L, Du X L, Wu Z M, et al, 2021. Temporal and spatial distribution characteristics of short-time heavy rainfall in Guizhou Province[J]. Torr Rain Dis, 40(4): 383-392 (in Chinese). DOI:10.3969/j.issn.1004-9045.2021.04.006
|
俞小鼎, 2013. 短时强降水临近预报的思路与方法[J]. 暴雨灾害, 32(3): 202-209. Yu X D, 2013. Nowcasting thinking and method of flash heavy rain[J]. Torr Rain Dis, 32(3): 202-209 (in Chinese). DOI:10.3969/j.issn.1004-9045.2013.03.002
|
张芳华, 陈涛, 张芳, 等, 2020. 2020年6—7月长江中下游地区梅汛期强降水的极端性特征[J]. 气象, 46(11): 1405-1414. Zhang F H, Chen T, Zhang F, et al, 2020. Extreme features of severe precipitation in Meiyu period over the middle and lower reaches of Yangtze River Basin in June-July 2020[J]. Meteor Mon, 46(11): 1405-1414 (in Chinese). DOI:10.7519/j.issn.1000-0526.2020.11.002
|
周璇, 孙继松, 张琳娜, 等, 2020. 华北地区持续性极端暴雨过程的分类特征[J]. 气象学报, 78(5): 761-777. Zhou X, Sun J S, Zhang L N, et al, 2020. Classification characteristics of continuous extreme rainfall events in North China[J]. Acta Meteor Sin, 78(5): 761-777 (in Chinese).
|
Chen Y, Liao Z, Shi Y, et al, 2021. Detectable increases in sequential flood-heatwave events across China during 1961-2018[J]. Geophys Res Lett, 48(6): e2021GL092549.
|
Li H Q, Cui X P, Zhang D L, 2017. A statistical analysis of hourly heavy rainfall events over the Beijing Metropolitan Region during the warm seasons of 2007-2014[J]. Int J Climatol, 37(11): 4027-4042. DOI:10.1002/joc.4983
|
Li W, Jiang Z H, Zhang X B, et al, 2018. 2018.Additional risk in extreme precipitation in China from 1.5℃ to 2.0℃ global warming levels[J]. Sci Bull, 63(4): 228-234. DOI:10.1016/j.scib.2017.12.021
|
Luo Y L, Gong Y, Zhang D L, 2014. Initiation and organizational modes of an extreme-rain-producing mesoscale convective system along a Mei-Yu front in East China[J]. Mon Wea Rev, 142(1): 203-221. DOI:10.1175/MWR-D-13-00111.1
|
Qin P H, Xie Z H, Zou J, et al, 2021. Future precipitation extremes in China under climate change and their physical quantification based on a regional climate model and CMIP5 model simulations[J]. Adv Atmos Sci, 38(3): 460-479. DOI:10.1007/s00376-020-0141-4
|
Wu J, Han Z Y, Xu Y, et al, 2020. Changes in extreme climate events in China under 1.5℃-4℃ global warming targets: projections using an ensemble of regional climate model simulations[J]. J Geophys Res Atmos, 125(2): e2019JD031057.
|
Zhai P M, Zhang X B, Wan H, et al, 2005. Trends in total precipitation and frequency of daily precipitation extremes over China[J]. J Climate, 18(7): 1096-1108.
|
Zhong L Z, Mu R, Zhang D L, et al, 2015. An observational analysis of warm-sector rainfall characteristics associated with the 21 July 2012 Beijing extreme rainfall event[J]. J Geophys Res Atmos, 120(8): 3274-3291. DOI:10.1002/2014JD022686
|
 2022, Vol. 48