厄尔尼诺和南方涛动(ENSO)现象是热带太平洋海气相互作用的重要系统,对全球气候年际变化具有重要影响。大量研究表明,ENSO是影响东亚气候异常最主要的前期信号之一,对我国季节气候预测具有非常重要的指示意义。因此,ENSO预报一直是我国季节气候预测一个重要方面。国际上早在20世纪80年代就开展了针对ENSO的预报研究和试验,逐渐形成了基于理论模型、统计预报、简化海气耦合模式和完备气候系统模式的ENSO预测技术体系(例如Cane et al, 1986; Zebiak et al, 1987; Chen et al, 1995; 2004; Kang et al, 2000; Kirtman, 2003; Luo et al, 2005; 2008; Zheng et al, 2006; Ham et al, 2009; Cheng et al, 2010; Izumo et al, 2010; Ren et al, 2014)。而且,伴随着ENSO理论研究的进步以及热带太平洋海气系统观测日益增加和复杂气候模式的持续发展,ENSO的预报水平得以稳步提升(Latif et al, 1994; Jin et al, 2006; Barnston et al, 2012)。
然而,近30年来,ENSO的形态特征发生了巨大改变,相比于传统的东部型ENSO(或称东太平洋型、冷舌型),中部型ENSO事件(也称中太平洋型、暖池型和假厄尔尼诺)频发,其主要特征和物理机制以及可预报性都与传统ENSO存在很大差异(Larkin et al, 2005a; 2005b; Ashok et al, 2007; Kao et al, 2009; Kug et al, 2009; Ren et al, 2013b)。这种中部型事件显著增多可能会导致ENSO整体预报技巧下降(Barnston et al, 2012)。更为重要的是,这两种类型ENSO事件对于东亚气候异常的影响有显著差别、甚至相反(Weng et al, 2007; Kim et al, 2009; Feng et al, 2010; 2011; Zhang et al, 2011; 2012; Yuan et al, 2012; 伍红雨等,2014)。ENSO自身状况的改变加大了我国气象灾害发生的风险和气候预测的难度。早在“九五”期间,国家气候中心已经发展了第一代ENSO监测预测系统。为满足当前日益增长的业务需求,国家气候中心自2012年起组织开发了新一代ENSO监测、分析和预测业务系统(SEMAP2.0),并在实时业务中加以应用。本文将首先介绍这一系统的构建和检验,进一步回顾该系统对于2014/2016年ENSO事件的预测情况。
1 SEMAP2.0简介近些年来,国际上业已开展了针对两类ENSO的可预报性研究和预报检验,但即使采用复杂的海气耦合系统,对于两类厄尔尼诺事件的预测,尤其是准确区分未来发生的厄尔尼诺事件属于何种类型,仍具有较大困难,有效预报时效不超过一个季度(Hendon et al, 2009;Lim et al, 2009;Jeong et al, 2012;Kirtman et al, 2013;Yang et al, 2014;Imada et al, 2015)。这主要是因为当代模式对两类厄尔尼诺的模拟仍存在较大困难和偏差。为此,新的ENSO系统发展充分考虑到了两种类型所带来的新需求。
SEMAP2.0综合利用了国际上ENSO动力学研究的多项新成果(例如,两类ENSO的充电振子机制、ENSO不稳定性量化指标等)和国家气候中心新一代气候系统模式,攻克多项诊断预测关键技术,实现了系统设计和业务技术以及产品开发的完全自主化,形成了动力学-物理统计-模式有机结合的技术体系,建成了兼具ENSO监测、分析和预测功能的一体化业务系统。SEMAP2.0包括实时监测子系统、动力学诊断分析子系统、以及物理统计预报、BCC_CSM1.1m集合预报和相似-动力预报三个预报子系统,整个系统的构架和流程如图 1所示。

|
图 1 SEMAP2.0结构流程图 Fig. 1 Schematic diagram of SEMAP2.0 |
基于实时获取的全球海洋分析和再分析资料(全球海表温度、次表层海温、纬向风应力等变量),针对初始时刻最近一年ENSO的发展和演变进行多变量监测。监测指标和对象包括各种ENSO关联的海温异常指数(NiñoZ、Niño3、Niño4、Niño1+2、Niño3.4、NiñoZ、NEPI、NCPI,其中后两个指数分别为Niño Eastern Pacific Index and Niño Central Pacific Index,定义参见Ren et al, 2011)、热带海表风应力、热带海洋上层热含量(50~300 m平均海温)、海洋次表层海温及20℃等温线深度的监测,同时包括近期ENSO动力诊断分析和“充放电”指数等相关动力过程的监测。监测产品制作所用的资料包括美国OISSTv2海表温度观测资料,以及美国国家环境预报中心(NCEP)的全球海洋数据同化系统(GODAS)的海洋分析/再分析资料。观测气候态取为国际通用的1981—2010年30年平均,模式气候态则取为1991—2010年平均(由于模式回算仅有1991年以后)。
1.2 ENSO动力学诊断分析子系统对于每一次ENSO事件发展,海洋各种物理反馈过程所起的作用是不同的。例如,东部型的1997/1998年ENSO事件发展过程中,温跃层反馈的作用非常显著;而对于2003年的中部型厄尔尼诺事件,纬向平流反馈也同样很重要。实时诊断当前ENSO发展过程中各项物理反馈过程的相对贡献,有助于认识ENSO发展的主导机制,并可以与历史上的ENSO事件进行比较,从而对ENSO未来发展有一个理性预判。忽略二阶非线性小项,海温倾向方程可以表示为:
| $ \begin{array}{l} \frac{{\partial T}}{{\partial t}} = - (\bar u\frac{{\partial T}}{{\partial x}} + \bar v\frac{{\partial T}}{{\partial y}} + \bar w\frac{{\partial T}}{{\partial z}} + u\frac{{\partial \bar T}}{{\partial x}} + \\ \;\;\;\;\;\;\;\;\;\;\;v\frac{{\partial \bar T}}{{\partial y}} + w\frac{{\partial \bar T}}{{\partial z}}) + Q \end{array} $ | (1) |
式中,T为温度异常,u、v、w为三维洋流异常,Q为向下的净辐射通量,气候平均态T、u、v、w分别为温度、三维洋流的气候态。对方程(1) 在赤道中东太平洋的混合层(取50 m深)进行积分,并忽略相对小项的贡献,可以得到:
| $ \begin{array}{l} \frac{{\partial < T{ > _E}}}{{\partial t}} = - (\frac{{ < \bar u{ > _E}}}{{{L_x}}} + \frac{{ < \bar v{ > _E}}}{{{L_y}}}) \times < T{ > _E} - \\ \;\;\;\;\;\;\;\;\;\;\;\;\;\;\;\;\;\; < u{ > _E} < \frac{{\partial \bar T}}{{\partial x}}{ > _E} + {[H(\bar w){{\bar w}_{50{\rm{m}}}}]_E} \times \\ \;\;\;\;\;\;\;\;\;\;\;\;\;\;\;\;\;\frac{{{T_{sub}}}}{{{H_m}}} - < w{ > _E} < H(\bar w)\frac{{\partial \bar T}}{{\partial z}}{ > _E} + < Q{ > _E} \end{array} $ |
方程右侧从左至右,第一项为平均环流衰减项,第二项为纬向平流反馈项,第三项为温跃层反馈项,第四项为Ekman反馈项,第五项为热力衰减项。之所以称作反馈项或者衰减项是因为 <u>E、Tsub、<w>E和<Q>E都可以表示为 <T>E的线性函数。因此,上式中各项本质上反映了ENSO的不稳定性指数,详细信息请参阅Jin等(2006)的推导。SEMAP2.0中开发了右端五个反馈项的实时监测预测业务产品。
1.3 物理统计预报子系统基于物理机制的统计预报方法一直在ENSO预测中扮演着重要角色。SEMAP2.0中发展的统计预报模型是基于两类ENSO自身的振荡机制(即充电振子机制,参见Ren et al, 2013a)和热带地区其他影响因子。这里综合考虑了赤道太平洋温跃层(WWV)、热带西太平洋西风(τ)、印度洋偶极子(IOD)等前期异常信号(Clarke et al, 2003;Izumo et al, 2010)。各Niño海温指数的预报方程可表示为
| $ \begin{array}{l} {\rm{Ni\tilde no(}}t{\rm{ + }}\Delta t{\rm{) = }}\alpha {\rm{Ni\tilde no(}}t{\rm{) + }}\beta \tau {\rm{(}}t{\rm{) + }}\\ \;\;\;\;\;\;\;\;\;\;\;\;\;\;\;\;\;\;\gamma {\rm{WWV(}}t{\rm{) + }}f{\rm{IOD(}}t{\rm{) + }}c \end{array} $ |
这里的海温指数包括Niño3、Niño4、Niño3.4、Niño1+2、NEPI和NCPI指数、以及NiñoZ指数。预报因子定义区域分别为WWV:[5°S~5°N、120°E~80°W];τ:[5°S~5°N、75°~100°E和129°~171°E];IOD:[10°S~10°N、50°~70°E]-[10°S~0、90°~110°E]。
1.4 BCC_CSM1.1m集合预报解释应用子系统BCC_CSM1.1m是国家气候中心开发的第二代气候系统模式,可提供季节至年际尺度的全球气候预测产品。该模式的水平分辨率为110km,包含了海洋、大气、陆面以及海冰等分量模式,其中大气分量模式为BCC_AGCM2.2,水平分辨率T106,垂直方向26层;海洋分量模式为MOM_L40,水平分辨率在热带为0.333°,热带外为1°。更详细的模式介绍请参阅Wu等(2014)文章。
基于BCC_CSM1.1m的集合预报在每个月上中旬(使用月初初始场)生成未来13个月的预测产品,为了消除初值误差,该模式系统采取了滞后平均预报和经验奇异向量扰动相结合的集合扰动方案,每次预测共有24个集合成员。通过对模式集合预报数据进行解释应用,SEMAP2.0可提供包括海温指数和次表层海温变化等多样化ENSO监测预测产品。
1.5 相似-动力ENSO预报子系统基于动力相似预报的策略,发展了适用于ENSO预测的相似误差订正方法,利用历史资料相似性信息对气候模式ENSO预报进行订正。将我国科学家提出的动力相似预报策略和方法运用到模式的ENSO预报中。通过诊断分析ENSO的模式预报误差时空变化特征,确认并建立预报误差与气候状态变量之间的统计关系,进而基于历史相似信息可对模式的ENSO预报误差进行的统计经验性估计,最终建立一个利用历史资料相似性信息的BCC_CSM1.1m业务模式的ENSO后处理误差订正系统,即相似-动力ENSO预报系统(Analogue-Dynamical ENSO Prediction System,简写为ADEPS,参见Ren et al, 2014),图 2给出了该系统的概念流程。

|
图 2 ADEPS的流程示意图 Fig. 2 Schematic diagram of the ADEPS |
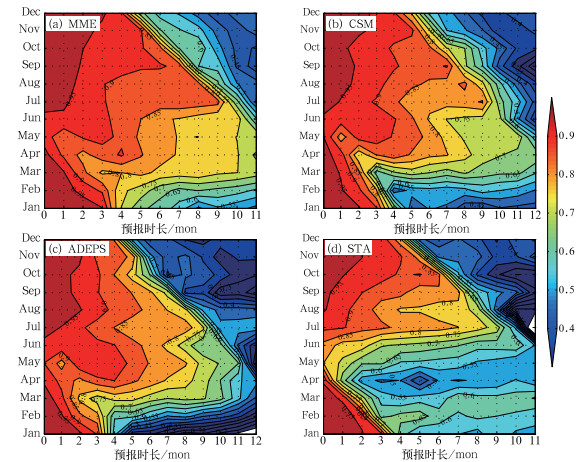
进一步对SEMAP2.0中各方法和集合平均预报技巧进行了独立样本检验,时段为1996-2015共20年。图 3给出了三种预测方法的历史回报技巧检验,从Niño3.4区海表温度异常指数的时间距平相关系数上来看,三种方法提前6个月对Niño3.4指数的预报技巧均达到了0.65以上,而三种方法的集合平均(MME)预测提前6个月技巧达到了约0.8,超过了任意一种单一预测方法的技巧,也比任意两种预测方法的集合平均都要高(图略)。从图 4种各月起报的技巧分布来看,ENSO春季预报障碍问题在各种预测方法中都存在(Webster et al, 1992; Latif et al, 1994; McPhaden 2003; Yu et al, 2007; Duan et al, 2016),但具体表现形式在不同预报方法中略有差别。值得注意的是,多方法集合平均的技巧不但显著提升,而且其技巧中反映出的春季预报障碍特征明显变弱。为什么三种技术路线差别很大的方法经过简单集合就能达到削弱春季预报障碍的效果?这无疑是一个非常值得深入研究的问题。

|
图 3 SEMAP2.0预测的Niño3.4指数时间距平相关系数(1996—2015年) [BCC_CSM1.1m(红线)、ADEPS(蓝线)、统计预测模型(STA,绿线),以及三种方法集合预测(MME,黑线)] Fig. 3 Temporal anomaly correlation coefficients of Niño3.4 index prediction by SEMAP2.0 during 1996-2015 for BCC_CSM1.1m (red line), ADEPS (blue line), statistical prediction model (STA, green line), and their ensemble mean (MME, black line), respectively |
|
图 4 BCC_CSM1.1m(b)、ADEPS(c)、物理统计预测方法(STA,d),以及三种方法集合预测(MME,a)的Niño3.4指数的时间距平相关系数(1996—2015年)随起报月份和预报时长(月)的变化 Fig. 4 Seasonal dependence of temporal anomaly correlation coefficients of Niño3.4 index prediction by SEMAP2.0 during 1996-2015 for BCC_CSM1.1m (b), ADEPS (c), statisitical prediction model (STA, d), and their ensemble mean (MME, a), respectively (Where x-axis is forecast months and y-axis the initial calendar months) |
2014/2016年ENSO事件是一次超强厄尔尼诺事件,其发展呈现出一波三折的特征。2014年初,海表西风异常和海洋次表层状态都非常有利于厄尔尼诺的生成,因此2014年1—6月,Niño3.4迅速由-0.5℃增加至0.5℃。然而,2014年夏季,东南太平洋的冷海温达到极低值,进而导致信风异常增强,并引起赤道中、东太平洋的东风异常,逆转了局地海洋暖的Kelvin波,抑制了有利于厄尔尼诺发展的海气耦合反馈过程,从而导致赤道中东太平洋暖海温发展停滞(Min et al, 2015)。2014年秋季,温跃层正反馈等过程引起中太平洋海温再次增暖,形成一次弱的中部型厄尔尼诺事件。在整个2015年,这一厄尔尼诺事件持续发展,由春季的中部型状态转变为东部型状态,并于2015年11月逐月海温达到峰值,形成一次超强厄尔尼诺事件,单月的Niño3.4指数峰值强度甚至超过了1997/1998年事件。进入2016年以后,此次事件在逐渐衰弱,预计春末夏初结束。
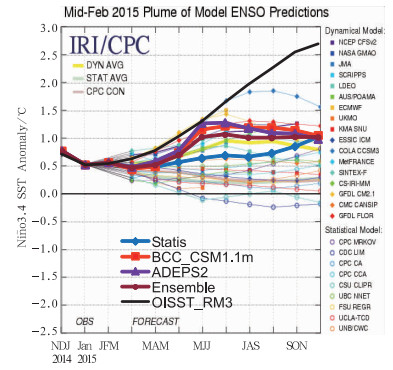
3.1 起报时间:2014年3月总体来看,SEMAP2.0中三个ENSO预报模型均能较好预测出2014年3月起报的未来1—11月Niño3.4指数的时间变化特征,预测结果与观测之间的相关系数分别为:CorADEPS=0.61, CorCSM=0.66, CorSTA=0.78,均方根误差分别为:RMSEADEPS=0.45, RMSECSM=0.33, RMSESTA=0.23。其中,STA的预测结果与实际观测更为接近。从图 5中时间变化来看,Niño 3.4指数在此时间段经历了两次小波动,并在2014年秋、冬季达到一个小高峰,但峰值仅为0.84。三种预测方法对2014年秋、冬季的Niño3.4指数的预测量值与实际观测均较为接近。同时,图 5还给出了2014年2月中旬起报的国际多模式集合预测结果。很明显,图中动力多模式集合的预测结果较统计多模型集合的预测更加接近观测。具体来看,CFSv2、KMA SNU、SCRIPPS、NASA GMAO动力模式以及FSU REGR统计模型高估了2014年底ENSO的强度,其他动力模型与图 5中的观测较为接近。综合来看,SEMAP2.0中三个预测模型较国际上多数模式更好地预测了此次事件,与观测情况更为吻合。

|
图 5 (a)2014年3月至2015年2月Niño3.4指数的时间变化[灰色柱形表示观测,红色、蓝色和绿色曲线分别表示于2014年3月起报的BCC_CSM1.1m、ADEPS和统计预报模型(STA)的预测结果];(b)2014年2月起报的国际多模式集合Niño3.4指数预报 Fig. 5 (a) Time evolution of Niño3.4 index from March 2014 to February 2015 (Grey columns represent observation; red, blue and green curves refer to the prediction results of BCC_CSM1.1m, ADEPS and STA); (b) IRI/CPC multi-model Niño3.4 index prediction |
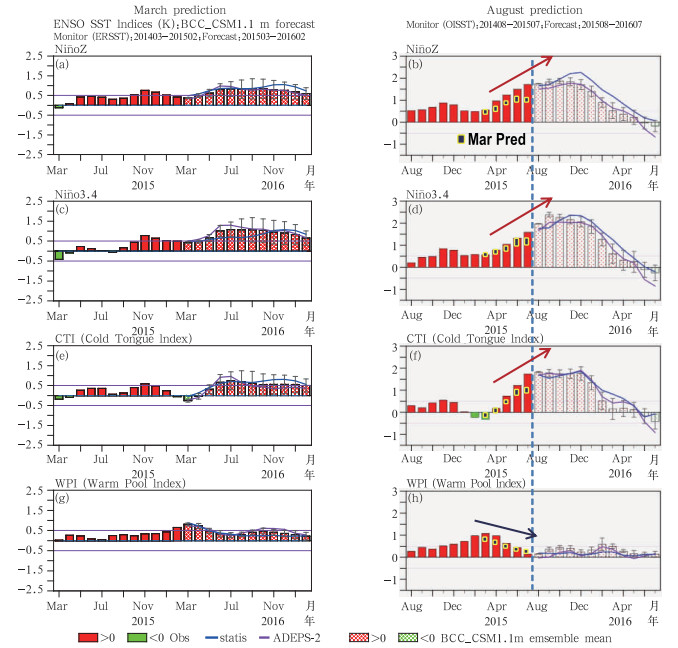
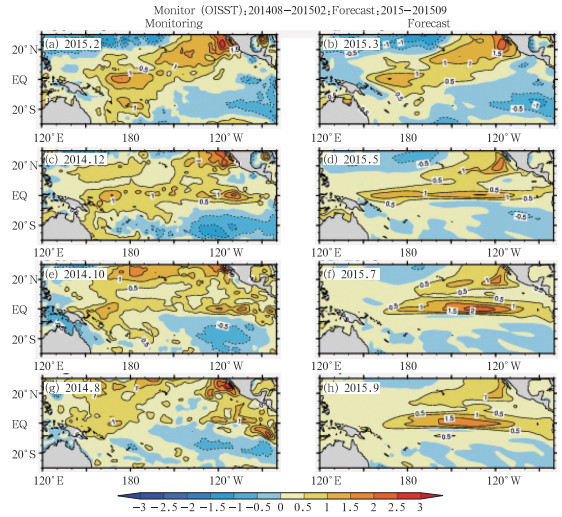
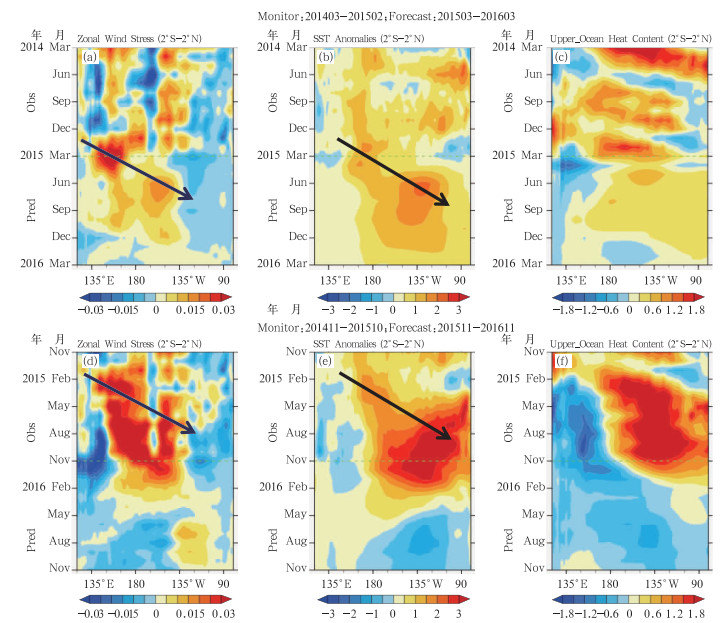
2015年3月SEMAP2.0成功地预报了厄尔尼诺事件的转型,如图 6所示,2015年3月中部型厄尔尼诺指数超过了0.5℃的阈值,然而东部型厄尔尼诺指数仍处于负值,在这样的初始状态下,SEMAP2.0成功预测出了2015年春、夏中部型指数的衰减以及东部型指数的增加,这与观测实际非常吻合。与国际上IRI/CPC多模式预测结果比较(图 7,取自http://iri.columbia.edu/our-expertise/climate/enso/),SEMAP2.0对此次厄尔尼诺事件强度的把握也处于中上水平。SST的空间分布如图 8所示,2015年2—3月,海温的增暖发生于赤道中太平洋,并延伸至南加州沿岸,而赤道东太平洋的海温处于负异常,形成典型的中部型厄尔尼诺状态。SEMAP2.0在初始场处于中部型厄尔尼诺状态的时候就成功预报出了其向东部型厄尔尼诺的转变,这与观测上NEPI和NCPI指数的演变非常一致。这次成功的厄尔尼诺类型转换预测很可能来源于SEMAP2.0对海表西风异常的把握(图 9),2015年3月SEMAP2.0成功预报出了赤道中太平洋的一次强西风异常事件,这对东部型厄尔尼诺的发展起到至关重要的作用,最终这次厄尔尼诺发展成为了一次极强的东部型事件,这对我国2015年汛期降水异常型的预测有着重要的指导意义(陈丽娟等,2016)。此外,SEMAP2.0在2014年9月起报的结果成功地预测出了ENSO暖事件在2014/2015冬、春季达到弱的中部型状态(图略)。
|
图 6 (a, c, e, g)2015年3月为起报月份,过去一年的监测和未来一年的预测[其中预测产品包括BCC_CSM1.1m集合预报结果(点填充直方图,“Ⅰ”型反映了集合预报的离散度),紫色实线为基于BCC_CSM1.1m集合预报的相似误差订正结果,蓝色实线为统计模式预报结果];(b, d, f, h)2015年8月预报为起报月份 (其中黄边小黑框代表2015年3月预报结果,其纵向长度代表不同方法的离散度) Fig. 6 Observations and predictions of different ENSO indices started from March 2015 (a, c, e, g) and August 2015 (b, d, f, h), respectively (CTI is the same as NEPI and WPI is the same as NCPI; the black boxes with yellow frame are predictions in March 2015 and size of the boxes denotes the spread of the three prediction tools) |
|
图 7 2015年3月SEMAP2.0预报的Niño3.4指数与IRI/CPC超级集合预报结果对比 Fig. 7 Comparison of Niño3.4 index predicted by SEMAP2.0 and IRI/CPC multi-models |
|
图 8 SST异常的空间分布演变,起报月份为2015年3月(a, c, e, f)观测,(b, d, f, h)预测 Fig. 8 Tropical Pacific SST anomalies for observations (a, c, e, f) and predictions (b, d, f, h) initiated from March 2015 |
|
图 9 赤道表面西风(a,d,单位:m·s-1)、SST(b,e,单位:℃)和海洋热容量(c,f,单位:℃)异常沿赤道剖面的时间演变(a, b, c)起报时间为2015年3月,(d, e, f)起报时间为2015年11月 Fig. 9 The zonal wind stress anomaly (a, d, unit: m·s-1), the SST anomaly (b, e, unit: ℃), and the upper ocean heat content anomaly (c, f, unit: ℃) averaged over 2°S -2°N (the data used before and after March 2015 is from observation and prediction from BCC_CSM1.1m, respectively) (d, e, f are the same as a, b, c, but for November 2015) |
图 10a进一步给出了2015年9月初值的SEMAP2.0预测结果。可以看到,三种预报方案基本一致地反映出未来一个季度内ENSO达到峰值及其后的衰减,这与观测是非常一致的(图 10b),即此次厄尔尼诺事件于2015年11月(未做3个月滑动平均)达到峰值。虽然三个预报子系统对于事件峰值强度的预测与观测有少许偏离,但是对于此次事件的冬季锁相特征均能较好地把握。尤其是SEMAP2.0中的统计预报模型,对于此次事件的强度变化和锁相特征均表现出色。可以看到,动力模式和统计模型相结合是SEMAP2.0的一大技术特色,这也反应在当前ENSO事件的实际预测中,即统计模型在一定程度上仍能够表现出很好的性能(表 1)。

|
图 10 2015年9月起报(a)和2016年3月起报(b)的SEMAP2.0的Niño3.4指数预报 Fig. 10 Observations (solid bars) and predictions (dot-filled bars) of Niño3.4 index starting from September 2015 (a) and March 2016 (b), respectively |
|
|
表 1 2015年9月起始的未来两个季度的Niño3.4指数预测结果(三组预测结果从上而下依次为:BCC_CSM1.1m集合预报结果、相似误差订正结果和统计模型预报结果)与实际观测的对比(单位:℃) Table 1 Predictions of Niño3.4 index of the next two seasons starting from september 2015 (unit: ℃) |
图 10b是SEMAP2.0对于此次事件衰减的预报结果。可以看到,三个预报方案基本给出了较为一致的结论,即该事件将于今年5月结束,并很可能转变为一次拉尼娜事件。然而,通过与IRI/CPC的16个动力预报模式和8个统计预报模式结果对比(图略)发现,对于不同的预报模式,预报时段在不到一个季节后即出现了明显的差异,表现出较大的离散度。因此,对于当前国际上主流的ENSO预报系统来讲,准确地预报出ENSO事件的强度、发生和位相转换时间仍然是一个严峻的挑战。
4 结论和讨论针对近些年来ENSO特征和气候影响上的显著变化,为了满足不断增长的业务需求,我们围绕ENSO监测预测开展了一系列科研和业务研发工作,并在实际业务中加以应用。近三年来,我们设计并发展了国家气候中心新一代ENSO监测、分析和预测业务系统(SEMAP2.0),于2015年底正式投入业务运行,每月实时为预报员和气候决策服务部门提供业务产品。SEMAP2.0包括实时监测、动力学诊断-归因分析、两类ENSO物理统计预报模型、BCC_CSM集合预报解释应用以及相似-动力预报订正等五个子系统。综合集成了国内外ENSO研究新成果,并自主研发了多项ENSO诊断预测新技术。该系统在发展过程中,本着边发展、边应用、边检验的思路,从2013年春季开始,连续多次在国家气候中心组织的ENSO专题业务会商上应用并给出预报意见,效果良好,多次得到预报员采纳。特别是在2014年春季给出了基本符合实际的夏秋季厄尔尼诺演变趋势预测、并较为准确地预报出了2014/2015冬季弱中部型厄尔尼诺状态、以及准确预报出了2015年春季以来厄尔尼诺的发展趋势和类型转换、2015年底达到峰值和极强强度。这些信息为汛期预测和年度预测提供了丰富而有价值的参考信息。
当然,我们也清醒地认识到,两类ENSO现象预测及其气候效应研究仍面临着很大困难和挑战。一方面,尽管现阶段的耦合模式在ENSO预测中显示出了一定的潜力和优势,完善和优化模式是提高ENSO预测技巧的有效途径,但现阶段统计模型仍然不能被完全取代,这一点从我们的系统中可以很好的体现出来。统计模型本身也有一定的改进潜力,越来越多的研究发现,南北太平洋赤道外的大气异常信号能超前于ENSO约1年左右发生(例如Vimont et al, 2003a; 2003b; Anderson 2003; Jin et al, 2009; Yu et al, 2011; Ding et al, 2015a; 2015b),因此基于这些最新的科研结果,ENSO物理统计预测子系统中可以引入热带外前期信号等影响因子,以期改进预测水平。另一方面,在准确地给出ENSO未来演变的背景下,考察伴随ENSO发生、发展和衰减的东亚地区气候,尤其是我国的气温和降水仍然存在着很大的不确定性。ENSO对我国气候的定量性的或者概率性的影响仍需要我们坚持不懈地探索。
陈丽娟, 顾薇, 丁婷, 等, 2016. 2015年汛期气候预测先兆信号的综合分析[J]. 气象, 42(4): 496-506. DOI:10.7519/j.issn.1000-0526.2016.04.014 |
伍红雨, 潘蔚娟, 王婷, 2014. 华南冬季气温异常与ENSO的关系[J]. 气象, 40(10): 1230-1239. DOI:10.7519/j.issn.1000-0526.2014.10.007 |
Anderson B T, 2003. Tropical Pacific sea-surface temperatures and preceding sea level pressure anomalies in the subtropical North Pacific[J]. J Geophys Res, 108: D23. DOI:10.1029/2003JD003805 |
Ashok K, Behera SK, Rao SA, et al, 2007. El Nino Modoki and its possible teleconnection[J]. J Geophys Res, 112: C11007. DOI:10.1029/2006JC003798 |
Barnston A G, Tippett M K, L'Heureux M L, et al, 2012. Skill of real-time seasonal ENSO model predictions during 2002-11: Is our capability increasing?[J]. Bull Amer Meteor Soc, 93(5): 631-651. DOI:10.1175/BAMS-D-11-00111.1 |
Cane M A, Zebiak S E, Dolan S C, 1986. Experimental forecasts of El Niño[J]. Nature, 321: 827-832. DOI:10.1038/321827a0 |
Chen D K, Cane M A, Kaplan A, et al, 2004. Predictability of El Niño over the past 148 years[J]. Nature, 428(6984): 733-736. DOI:10.1038/Nature02439 |
Chen D K, Zebiak S E, Busalacchi A J, et al, 1995. An improved procedure for El Niño forecasting-implications for predictability[J]. Science, 269(523): 1699-1702. |
Cheng Y J, Tang Y M, Zhou X B, et al, 2010. Further analysis of singular vector and ENSO predictability in the Lamont model-Part Ⅰ:singular vector and the control factors[J]. Clim Dyn, 35: 807-826. DOI:10.1007/s00382-009-0595-7 |
Clarke A J, Van Gorder S, 2003. Improving El Niño prediction using a space-time integration of Indo-Pacific winds and equatorial Pacific upper ocean heat content[J]. Geophys Res Lett, 30(7). DOI:10.1029/2002GL016673 |
Ding R Q, Li J P, Tseng Y-H, et al, 2015a. The Victoria mode in the North Pacific linking extratropical sea level pressure variations to ENSO[J]. J Geophys Res, 120: 27-45. DOI:10.1002/2014JD022221 |
Ding R Q, Li J P, Tseng Y-H, 2015b. The impact of South Pacific extratropical forcing on ENSO and comparisons with the North Pacific[J]. Clim Dyn, 44: 2017-2034. DOI:10.1007/s00382-014-2303-5 |
Duan W S, Hu J Y, 2016. The initial errors that induce a significant "spring predictability barrier" for El Niño events and their implications for target observation:results from an earth system model[J]. Clim Dyn. DOI:10.1007/s00382-015-2789-5 |
Feng J, Li J, 2011. Influence of El Niño Modoki on spring rainfall over south China[J]. J Geophys Res, 116: D13102. DOI:10.1029/2010JD015160 |
Feng J, Wang L, Chen W, et al, 2010. Different impacts of two types of Pacific Ocean warming on Southeast Asian rainfall during boreal winter[J]. J Geophys Res-Atmos, 115: D24122. DOI:10.1029/2010jd014761 |
Ham YG, Kug J S, Kang I S, 2009. Optimal initial perturbations for El Niño ensemble prediction with ensemble Kalman filter[J]. Clim Dyn, 33(7): 959-973. DOI:10.1007/s00382-009-0582 |
Hendon H H, Lim E, Wang G M, et al, 2009. Prospects for predicting two flavors of El Nino[J]. Geophys Res Lett, 36: L19713. DOI:10.1029/2009GL040100 |
Imada Y, Tatabe H, Ishii M, et al, 2015. Predictability of two types of El Niño assessed using an extended seasonal prediction system by MIROC[J]. Mon Wea Rev, 143: 4597-4617. DOI:10.1175/MWR-D-15-0007.1 |
Izumo T, Vialard J, Lengaigne M, et al, 2010. Influence of the state of the Indian Ocean Dipole on the following year's El Niño[J]. Nat Geosci, 3(3): 168-172. DOI:10.1038/ngeo760 |
Jeong H I, Lee D Y, Ashok K, et al, 2012. Assessment of the APCC coupled MME suite in predicting the distinctive climate impacts of two flavors of ENSO during boreal winter[J]. Clim Dyn, 39(1-2): 475-493. DOI:10.1007/s00382-012-1359-3 |
Jin D, Kirtman B P, 2009. Why the Southern Hemisphere ENSO responses lead ENSO?[J]. J Geophys Res, 114: D23101. DOI:10.1029/2009JD012657 |
Jin F F, Kim S T, Bejarano L, 2006. A coupled-stability index for ENSO[J]. Geophys Res Lett, 33(23). DOI:10.1029/2006GL027221 |
Kang I S, Kug J S, 2000. An El Niño Prediction System using an intermediate ocean and a statistical atmosphere[J]. Geophy Res Lett, 27(8): 1167-1170. DOI:10.1029/1999GL011023 |
Kao H Y, Yu J Y, 2009. Contrasting eastern-Pacific and central-Pacific types of ENSO[J]. J Climate, 22(3): 615-632. DOI:10.1175/2008JCLI2309.1 |
Kim H M, Webster P J, Curry J A, 2009. Impact of shifting patterns of Pacific Ocean warming on North Atlantic tropical cyclones[J]. Science, 325(5936): 77-80. DOI:10.1126/science.1174062 |
Kirtman P B, 2003. The COLA anomaly coupled model:Ensemble ENSO prediction[J]. Mon Wea Rev, 131: 2324-2341. DOI:10.1175/1520-0493(2003)131<2324:TCACME>2.0.CO;2 |
Kirtman P B, Infanti J, Larson S, 2013. The diversity of El Niño in the North American multi-model prediction system[J]. US Clivar Variations, 11: 18-23. |
Kug J S, Jin F F, An S I, 2009. Two types of El Niño events:Cold tongue El Niño and warm pool El Niño[J]. J Climate, 22(6): 1499-1515. DOI:10.1175/2008JCLI2624.1 |
Larkin N K, Harrison D E, 2005a. On the definition of El Niño and associated seasonal average U.S. weather anomalies[J]. Geophys Res Lett, 32: L13705. DOI:10.1029/2005GL022738 |
Larkin N K, Harrison D E, 2005b. Global seasonal temperature and precipitation anomalies during El Niño autumn and winter[J]. Geophys Res Lett, 32: L16705. DOI:10.1029/2005GL022860 |
Latif M, Barnett T P, Cane M A, et al, 1994. A review of ENSO prediction studies[J]. Clim Dyn, 9(4-5): 167-179. DOI:10.1007/Bf00208250 |
Lim E P, Hendon H H, Hudson D, et al, 2009. Dynamical Forecast of Inter-El Niño Variations of Tropical SST and Australian Spring Rainfall[J]. Mon Wea Rev, 137(11): 3796-3810. DOI:10.1175/2009MWR2904.1 |
Luo J J, Masson S, Behera S, et al, 2005. Seasonal climate predictability in a coupled OAGCM using a different approach for ensemble forecasts[J]. J Climate, 18(21): 4474-4497. DOI:10.1175/JCLI3526.1 |
Luo J J, Masson S, Behera S K, et al, 2008. Extended ENSO predictions using a fully coupled ocean-atmosphere model[J]. J Climate, 21(1): 84-93. DOI:10.1175/2007jcli1412.1 |
McPhaden M J, 2003. Tropical Pacific Ocean heat content variations and ENSO persistence barriers[J]. Geophys Res Lett, 30(9): 1480. DOI:10.1029/2003gl016872 |
Min Q, Su J, Zhang R, et al, 2015. What hindered the El Niño pattern in 2014?[J]. Geophys Res Lett, 42: 6762-6770. DOI:10.1002/2015GL064899 |
Ren H L, Liu Y, Jin F F, et al, 2014. Application of the Analogue-Based Correction of Errors Method in ENSO Prediction[J]. Atmos Oce Sci Lett, 7: 157-161. DOI:10.3878/j.issn.1674-2834.13.0080 |
Ren H L, Jin F F, 2011. Nino indices for two types of ENSO[J]. Geophys Res Lett, 38. DOI:10.1029/2010GL046031 |
Ren H L, Jin F F, 2013. Recharge oscillator mechanisms in two types of ENSO[J]. J Climate, 26(17): 6506-6523. DOI:10.1175/JCLI-D-12-00601.1 |
Ren H L, Jin F F, Stuecker M F, et al, 2013. ENSO regime change since the late 1970s as manifested by two types of ENSO[J]. J Meteor Soc Japan, 91(6): 835-842. DOI:10.2151/jmsj.2013-608 |
Vimont D J, Battisti D S, Hirst A C, 2003b. The seasonal footprinting mechanism in the CSIRO general circulation models[J]. J Climate, 16: 2653-2667. DOI:10.1175/1520-0442(2003)016<2653:TSFMIT>2.0.CO;2 |
Vimont D J, Wallace J M, Battisti D S, 2003a. The seasonal footprinting mechanism in the Pacific:Implications for ENSO[J]. J Climate, 16: 2668-2675. DOI:10.1175/1520-0442(2003)016<2668:TSFMIT>2.0.CO;2 |
Webster P J, Yang S, 1992. Monsoon and ENSO-selectively interactive systems[J]. Q J R Meteorol Soc, 118(507): 877-926. DOI:10.1002/qj.49711850705 |
Weng H Y, Ashok K, Behera S K, et al, 2007. Impacts of recent El Niño Modoki on dry/wet conditions in the Pacific rim during boreal summer[J]. Clim Dyn, 29(2-3): 113-129. DOI:10.1007/s00382-007-0234-0 |
Wu T, Song L, Li W, et al, 2014. An overview of progress in climate system model development at the Beijing Climate Center applications for climate change studies[J]. J Meteor Res, 28: 34-56. DOI:10.1007/s13351-014-3041-7 |
Yang S, Jiang X W, 2014. Prediction of Eastern and Central Pacific ENSO events and their impacts on ast Asian climate by the NCEP climate forecast system[J]. J Climate, 27(12): 4451-4472. DOI:10.1175/JCLI-D-13-00471.1 |
Yu J Y, Kao H Y, 2007. Decadal changes of ENSO persistence barrier in SST and ocean heat content indices:1958-2001[J]. J Geophys Res-Atmos, 112(D13): D13106. DOI:10.1029/2006jd007654 |
Yu J Y, Kim ST, 2011. Relationships between extratropical sea level pressure variations and the central Pacific and eastern Pacific types of ENSO[J]. J Climate, 24: 708-720. DOI:10.1175/2010JCLI3688.1 |
Yuan Y, Yang S, 2012. Impacts of different types of El Niño on the East Asian climate:Focus on ENSO cycles[J]. J Climate, 25: 7702-7722. DOI:10.1175/JCLI-D-11-00576.1 |
Zebiak S E, Cane M A, 1987. A model El Niño-Southern Oscillation[J]. Mon Wea Rev, 115(10): 2262-2278. DOI:10.1175/1520-0493(1987)115<2262:AMENO>2.0.CO;2 |
Zhang W J, Jin F F, Li J, et al, 2011. Contrasting impacts of two-type El Niño over the western north Pacific during boreal autumn[J]. J Meteor Soc Jap, 89(5): 563-569. DOI:10.2151/jmsj.2011-510 |
Zhang W J, Jin F F, Ren H L, et al, 2012. Differences in teleconnection over the North Pacific and rainfall shift over the USA associated with two types of El Niño during boreal autumn[J]. J Meteor Soc Japan, 90(4): 535-552. DOI:10.2151/jmsj.2012-407 |
Zheng F, Zhu J, Zhang R H, et al, 2006. Ensemble hindcasts of SST anomalies in the tropical Pacific using an intermediate coupled model[J]. Geophys Res Lett, 33: L19604. DOI:10.1029/2006GL026994 |
 2016, Vol. 42