2. 中国气象局地球系统数值预报中心, 北京 100081;
3. 中国气象科学研究院灾害天气国家重点实验室, 北京 100081;
4. 温江国家气候观象台, 成都 611133;
5. 国家卫星气象中心/国家空间天气监测预警中心, 北京 100081;
6. 许健民气象卫星创新中心, 北京 100081;
7. 中国气象局遥感卫星辐射测量和定标重点开放实验室, 北京 100081
2. Earth System Modeling and Prediction Centre, CMA, Beijing 100081;
3. State Key Laboratory of Severe Weather, Chinese Academy of Meteorological Sciences, Beijing 100081;
4. Wenjiang National Climatology Observatory, Chengdu 611133;
5. National Satellite Meteorological Centre/National Centre for Space Weather, Beijing 100081;
6. Innovation Center for FengYun Meteorological Satellite (FYSIC), Beijing 100081;
7. Key Laboratory of Radiometric Calibration and Validation for Environmental Satellites, CMA, Beijing 100081
全球风场是改善数值天气预报初始条件的重要观测资料之一(Bormann and Thépaut,2004;许健民和张其松,2006;Baker et al,2014)。近年来,全球三维风场探测资料日益丰富(杨天杭等,2021),静止轨道气象卫星成像仪卫星云导风产品能提供全球高时空分辨率、不同高度层的风场观测资料,是海洋和高原等常规观测不足地区风场观测的重要补充(薛纪善,2009;Stoffelen et al,2020)。
卫星云导风主要包括红外、水汽和可见光通道,分别以红外通道云、水汽目标和可见光通道云为示踪物,其误差主要来自目标追踪和高度指定(Bormann et al,2002;Le Marshall et al,2004;周润东等,2024),而高度指定误差的占比约达70%(Velden et al,2005;Velden and Bedka, 2009)。以红外通道云导风为例,产生目标追踪误差是因为目标追踪框中检测到以不同速度移动的各类型云,导致示踪物选取困难(Bormann et al,2003;Borde and Oyama, 2008); 高度指定误差是由于大气中广泛存在的透明云、多层云等复杂条件,降低了高度指定的精度(Roebeling et al,2013)。减小卫星云导风误差能够提高资料在数值预报系统中的同化数据量,是提升其对初始场改进贡献的重要手段(杨璐等,2022;Lean and Bormann, 2023)。其中,目标追踪误差通过示踪物代表运动像元选取方法(Nieman et al,1997;Xu et al,2002;张晓虎等,2017a)、交叉相关贡献法(Borde et al,2014)及嵌套追踪算法(Daniels et al,2013)等得到了较好解决,使其显著降低(Borde et al,2014)。云导风高度指定误差也通过改进反演方法得到改善,包括将高、中、低云分别处理(Xu et al,1998),利用风场一致性原理修正示踪物高度分配过高的问题等(陈华等,1999;Yang et al,2012)。
此外,用于反演云顶高度的二氧化碳切片法(Paul Menzel et al,2010),改进了红外双通道法(Heidinger and Pavolonis, 2009)对光学薄卷云云高敏感度低的问题,其云顶高度更接近主动激光雷达观测的云顶高度(Heidinger et al,2010)。而二氧化碳切片法也随之被用于改进云导风的高度指定。欧洲气象卫星开发组织(EUMETSAT)在极轨卫星极区云导风产品中采用了结合二氧化碳切片法的最佳云分析产品来指定云的高度(Wanzong et al,2016)。美国国家海洋和大气管理局(NOAA)静止环境观测卫星-16(GOES-16)的高级基线成像仪云导风产品,在原来红外通道高度指定法的基础上结合了二氧化碳切片法,产品精度有所提高(Daniels et al,2013)。
我国第二代静止轨道气象卫星风云四号(FY-4)上搭载了先进的静止轨道辐射成像仪(AGRI),其卫星云导风算法沿用了FY-2的分层简化算法(Xu et al,2002;许健民和张其松,2006;万晓敏等,2017;许健民,2020)和交叉相关系数法(张晓虎等,2017a)进行目标追踪,对不透明云采用等效黑体温度法进行高度指定,对半透明云选用冷区段大贡献像元的辐射亮温与模式预报温度廓线插值来估计高度(张晓虎等,2017b)。AGRI在通道设置上与高级基线成像仪相似,其云顶高度产品也结合了二氧化碳切片法(Min et al,2020;王富和赵宇,2021),与葵花八号卫星(Himawari-8)高像素红外线成像仪和中分辨率成像光谱仪等的云顶高度产品一致性较好(Tan et al,2019;王富和赵宇,2021),具备应用于云导风高度指定的能力。
本研究利用FY-4A云顶高度产品对云导风进行高度再指定,结合跟踪框范围内的示踪物空间代表性像元搜索、时间代表性像元搜索,发展了改进云导风精度的方法。
1 数据及方法 1.1 卫星和再分析数据所用资料为国家卫星气象中心提供的FY-4A云导风资料(万晓敏等,2019)及云顶高度资料。
(1) 云导风产品:FY-4A通道12(中心波段10.8 μm)的云导风资料,时间分辨率为3 h,空间分辨率为48 km。
(2) 云顶高度产品:FY-4A云顶高度资料算法主要采用一维变分方法利用通道12~14(王富和赵宇,2021;Wang et al,2022)的云导风资料,时间分辨率约为15 min,空间分辨率为4 km。
(3) 再分析数据:欧洲中期天气预报中心(ECMWF)第五代全球大气再分析资料(ERA5)作为研究的参考场,对比分析高度再指定前后云导风资料的偏差分布情况,时间分辨率为1 h,空间分辨率为0.25°。
首先,对不同季节的卫星资料进行时空匹配,包括四个代表月,2022年7月(夏)和10月(秋),2023年1月(冬)和4月(春)。选择质量较高的云导风资料,即质量控制参数大于85(Liang et al,2021);选择每日四个时次(00、06、12、18时,世界时,下同)资料;选取云导风观测对应的前后两次云顶高度产品,选择云导风中心点周围12像元×12像元框内的云顶高度资料。
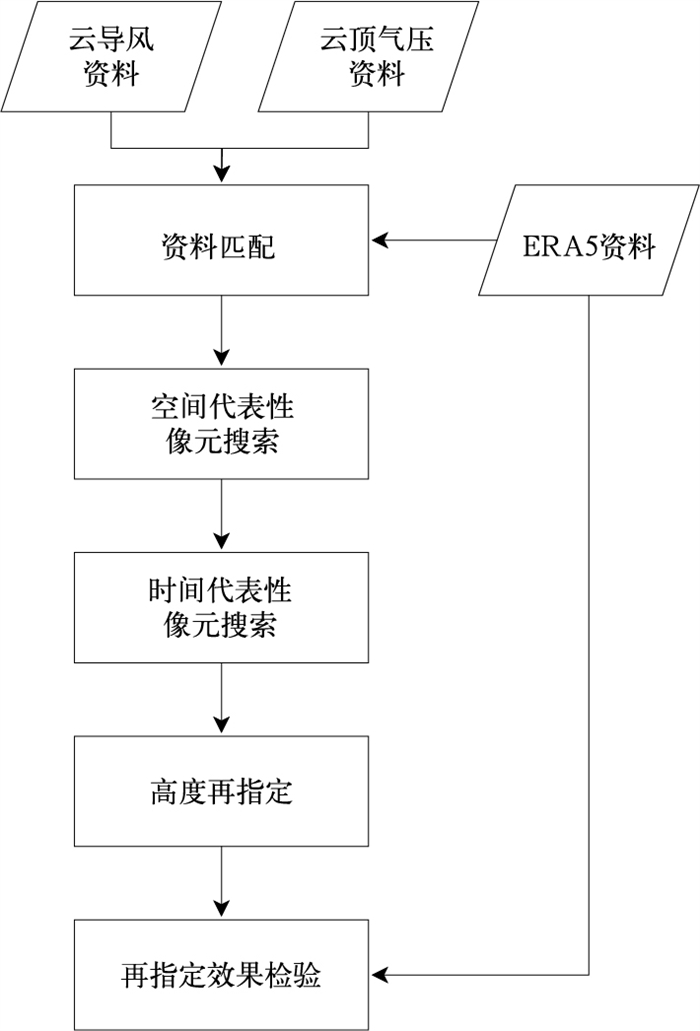
1.2 高度再指定方法利用云顶高度产品对云导风进行高度再指定的方法流程如图 1所示。
|
图 1 FY-4A云导风云顶高度再指定流程图 Fig. 1 Diagram of the cloud top height reassignment process of FY-4A atmospheric motion vectors |
其四个主要步骤为:
(1) 根据云导风的行列号信息对云顶高度数据进行匹配,得到每个跟踪框内云顶高度的样本数据集。
(2) 基于NOAA高级基线成像仪云导风产品的嵌套追踪算法(Daniels et al,2013)设计了空间代表性像元搜索方法,用于获取跟踪框内代表运动示踪物的范围。利用一个小窗口来对跟踪框内所有云顶高度进行检索(Oh et al,2019),“嵌套”在跟踪框内的小窗口范围是不固定的,即用3像元×3像元、5像元×5像元、7像元×7像元、9像元×9像元窗口检验,得到云顶高度一致性最强(云顶高度的二阶矩最小)的窗口W:
| $ W=\operatorname{argmin} \sqrt{\frac{1}{n} \sum\limits_{i=1}^n\left(P_{\mathrm{c} i}-\mu\right)^2} $ | (1) |
式中:argmin表示取使后面表达式最小的参数值,n表示窗口W内的数据点数量,Pci表示第i个数据点的云顶高度(单位:hPa),μ表示窗口W内云顶高度的平均值(单位:hPa)。
(3) 根据NOAA云导风算法中对云顶高度数据的应用,设计了时间代表性像元搜索方法,用于更好地处理每个目标场景中生成的两个时次窗口样本,两者云顶高度的平均值分别记为
(4) 采用代表性像元云顶高度的平均值对云导风高度进行替换,完成云导风高度再指定。
| $ H_{\mathrm{AMVs}}^{\mathrm{new}}= \begin{cases}\frac{1}{2}\left(\overline{H_1}+\overline{H_2}\right) & \left|\overline{H_1}-\overline{H_2}\right|<300 \\ \overline{H_1} & \left|\overline{H_1}-\overline{H_2}\right| \geqslant 300\end{cases} $ | (2) |
式中:HAMVsnew为替换后的云导风高度(单位:hPa),
选取ERA5再分析资料作为参考场,分别进行偏差(Bias)、均方根误差(RMSE)、矢量均方差(VMSE)、平均绝对百分比误差(MAPE)分布统计,计算方法分别见式(3)~式(6)。
| $ \operatorname{Bias}=\frac{1}{n} \sum\limits_{i=1}^n\left(U_i-u_i\right) $ | (3) |
| $ \mathrm{RMSE}=\sqrt{\frac{\sum\limits_{i=1}^n\left(U_i-u_i\right)^2}{n}} $ | (4) |
| $ \mathrm{VMSE}=\frac{1}{n} \sum\limits_{i=1}^n \sqrt{\left(U_i-u_i\right)^2+\left(V_i-v_i\right)^2} $ | (5) |
| $ \text { MAPE }=\frac{1}{n} \sum\limits_{i=1}^n\left(\frac{\left|U_i-u_i\right|}{\bar{u}}\right) \times 100 \% $ | (6) |
式中:Ui、Vi表示云导风风速,ui、vi表示对应的ERA5风速,u表示对应层平均风速值,n代表所有云导风数量。
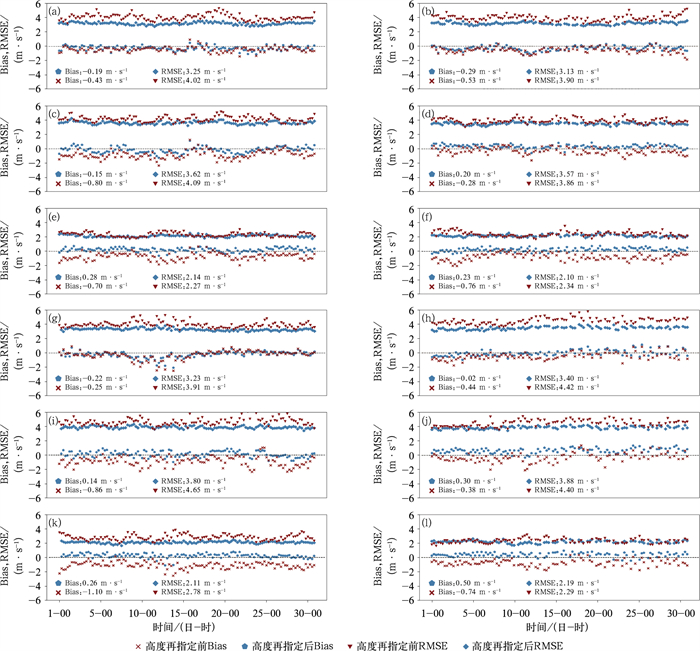
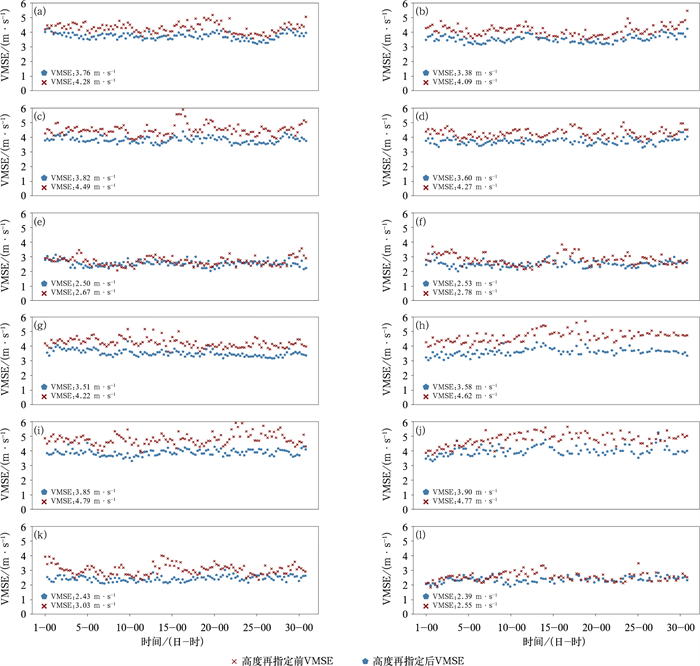
2 高度再指定结果与分析 2.1 高度再指定对云导风精度的改进FY-4A云导风产品经高度再指定后精度有所提升。由图 2可见,高层(p<400 hPa)春季(2023年4月)平均Bias减小最明显,从-0.44 m·s-1降低到-0.02 m·s-1;中层(400 hPa≤p<700 hPa)秋季(2022年10月)高度再指定后RMSE最小,为3.57 m·s-1;低层(p≥700 hPa)秋季(2022年10月)平均Bias减小最明显,从-0.76 m·s-1降低到0.23 m·s-1。RMSE最大值与最小值的差从1.95 m·s-1降低到0.88 m·s-1,数据长期一致性有所提高。此外,三层的VMSE均有明显降低(图 3),高层四个代表月的平均VMSE从4.30 m·s-1降至3.56 m·s-1,中层从4.58 m·s-1降至3.79 m·s-1,低层从2.76 m·s-1降至2.46 m·s-1,低层改善效果略低于中、高层。
|
图 2 不同季节高度再指定前后FY-4A云导风(a, b, g, h)高层(p<400 hPa),(c, d, i, j)中层(400 hPa≤p<700 hPa)和(e, f, k, l)低层(p≥700 hPa) U分量Bias及RMSE随时间的变化(a, c, e)夏季:2022年7月,(b, d, f)秋季:2022年10月,(g, i, k)冬季:2023年1月,(h, j, l)春季:2023年4月 Fig. 2 Temporal variations of Bias and root mean square error (RMSE) for the U-component of FY-4A atmospheric motion vectors in (a, b, g, h) high layer (p < 400 hPa), (c, d, i, j) medium layer (400 hPa≤p < 700 hPa), (e, f, k, l) low layer (p≥700 hPa) before and after height reassignment in different seasons (a, c, e) summer: July 2022, (b, d, f) autumn: October 2022, (g, i, k) winter: January 2023, (h, j, l) spring: April 2023 |
|
图 3 不同季节高度再指定前后FY-4A云导风(a, b, g, h)高层(p<400 hPa), (c, d, i, j)中层(400 hPa≤p<700 hPa)和(e, f, k, l)低层(p≥700 hPa) VMSE随时间的变化(a, c, e)夏季:2022年7月,(b, d, f)秋季:2022年10月,(g, i, k)冬季:2023年1月,(h, j, l)春季:2023年4月 Fig. 3 Temporal variations of vector mean square error (VMSE) for FY-4A atmospheric motion vectors in (a, b, g, h) high layer (p < 400 hPa), (c, d, i, j) medium layer (400 hPa≤p < 700 hPa), (e, f, k, l) low layer (p≥700 hPa) before and after height reassignment in different seasons (a, c, e) summer: July 2022, (b, d, f) autumn: October 2022, (g, i, k) winter: January 2023, (h, j, l) spring: April 2023 |
对比不同季节结果也可以发现,春季和秋季中、高层的高度再指定效果最好,这与卷云在春秋季节出现频率较高且光学厚度较大有关(Zhao et al,2020),说明二氧化碳切片法对卷云高度的改进效果明显。
整体统计结果显示(表 1),高层四个代表月的平均RMSE从4.06 m·s-1降低到3.25 m·s-1,最为显著,中层从4.25 m·s-1降低到3.71 m·s-1,低层从2.42 m·s-1降低到2.13 m·s-1,且各层MAPE均有所降低,中层从18.88%降低到16.83%,改进最明显。
|
|
表 1 高度再指定前后FY-4A云导风检验统计结果 Table 1 Statistical validation results of FY-4A atmospheric motion vectors before and after height reassignment |
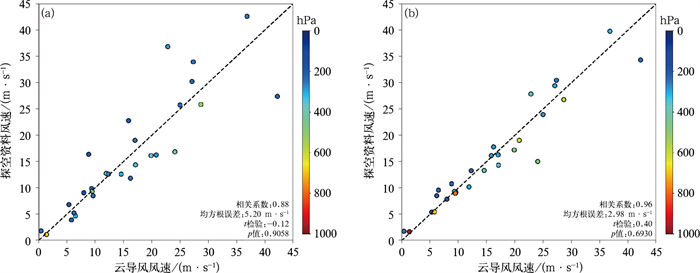
此外,利用2022年7月广州、北京两个站的探空资料对高度再指定前后的云导风进行检验(图 4),以去除ERA5资料的影响(Yao et al,2020;Li et al,2024)。由于探空资料观测频次较低,两个站能够与云导风匹配的观测分别为13次和15次,而高度再指定后云导风与探空资料的RMSE由高度再指定前的5.20 m·s-1降低到2.98 m·s-1,相关系数由0.88提升至0.96,t检验相关系数从-0.12提升至0.40。这也进一步说明高度再指定方法能够有效提高云导风数据质量。
|
图 4 2022年7月广州和北京站高度再指定前后FY-4A云导风与探空高空风场风速散点图(a)高度再指定前,(b)高度再指定后 注:填色为云导风高度。 Fig. 4 Scatter plots of wind speed between FY-4A atmospheric motion vectors and sounding high-altitude wind field data (a) before and (b) after height reassignment at Guangzhou and Beijing sounding stations in July 2022 |
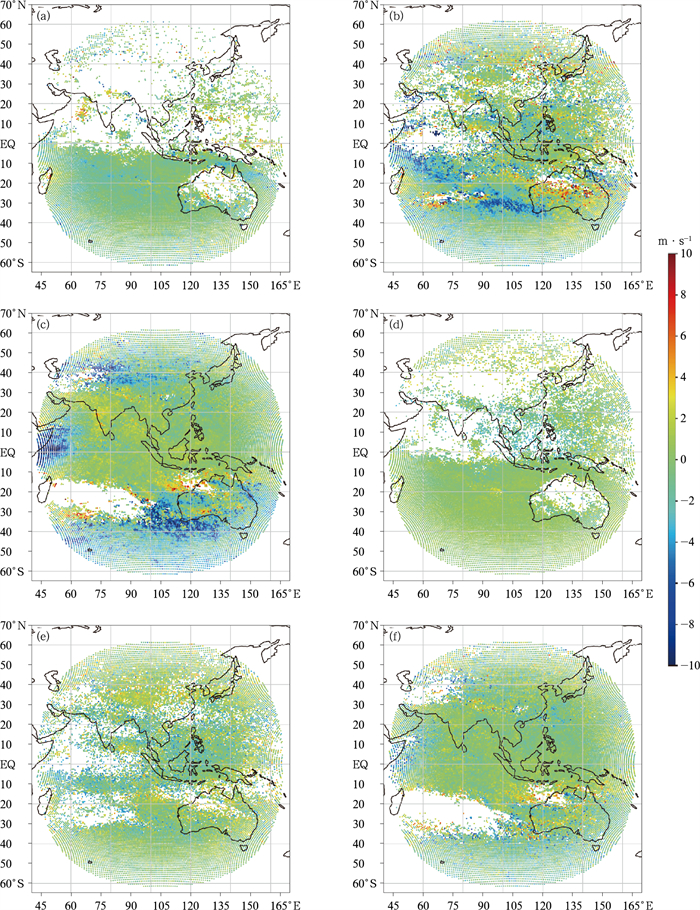
由2022年7月FY-4A云导风产品高度再指定前后空间分布精度检验结果(图 5)可见,月平均Bias负值的连续大面积集中现象得到了明显改善。其中,中、高层南半球海洋上空的大量连续负Bias,其绝对值(大于7 m·s-1;图 5b,5c)降低到约4 m·s-1(图 5e, 5f)。这可能是由于指定的云导风高度偏高,导致云导风风速低于ERA5风速(Daniels et al,2013),高度再指定明显改善了这一现象。
|
图 5 2022年7月(a, d)低层,(b, e)中层和(c, f)高层FY-4A云导风平均U分量风速Bias (a~c)高度再指定前,(d~f)高度再指定后 Fig. 5 Mean U-component wind speed Bias for FY-4A atmospheric motion vectors in (a, d) low layer, (b, e) medium layer and (c, f) high layer in July 2022 (a-c) before height reassignment, (d-f) after height reassignment |
高度再指定后各纬度低层云导风数量有所增多,高层数量减少,中层南半球数量减少、北半球增多(图 6)。2022年7月,南半球低层云导风的数量明显多于北半球,这一现象可能是由于7月南半球处于冬季,更容易形成低云(Verlinden et al,2011)。总体而言,高度再指定后,低层云导风的数量增加了50.99%,而中、高层云导风的数量分别减少0.76%和20.56%(表略)。

|
图 6 2022年7月高度再指定前后FY-4A云导风总数随纬度的分布 Fig. 6 Distribution of the total number of FY-4A atmospheric motion vectors in July 2022 before and after height reassignment |
此外,统计了2022年7月高度再指定前后始终位于同一分层的云导风样本,发现Bias和RMSE同样均有所减小(表 2)。低层始终位于同一分层的平均样本数量为1197个(占低层再指定前95.53%,占再指定后63.23%),中层平均样本数量为699个(占再指定前59.03%,占再指定后58.59%),高层平均样本数量为2527个(占再指定前77.11%,占再指定后97.08%)。这一结果表明,云导风Bias及RMSE的改善并非由整体高度降低(即检验背景场的风速减小)所致,而是云顶高度指定精度提升所带来的影响。
|
|
表 2 2022年7月高度再指定前后位于同一分层的FY-4A云导风Bias和RMSE Table 2 Bias and RMSE of FY-4A atmospheric motion vectors within the same layer before and after height reassignment in July 2022 |
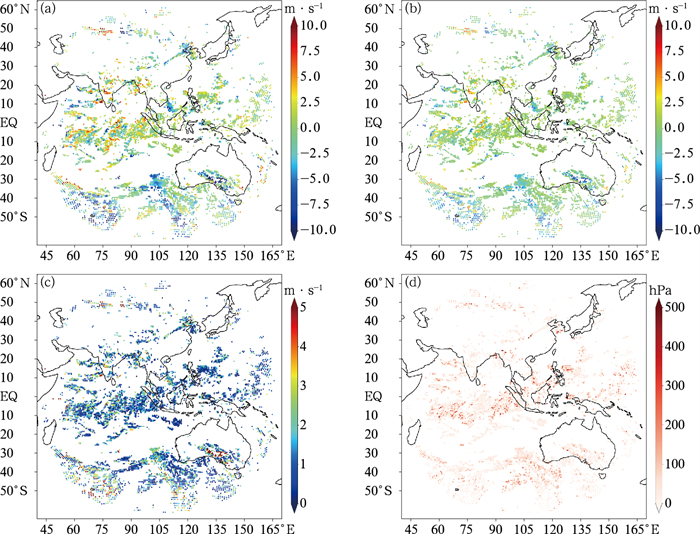
高度再指定改善了在云顶高度发生突变情况下的云导风准确性。有些云顶高度在15 min观测间隔内会发生快速变化,可能是由于云在该位置的快速抬升或下降,导致云导风高度Bias较大。通过分析云导风速度来判断其在观测间隔内的移动距离,并统计始终存在于同一跟踪框内的样本,可以更准确地评估云顶高度变化与云导风Bias的关系。2022年7月22日00时至24日00时云顶高度变化与云导风Bias的检验结果(图 7)显示,云顶高度快速变化的区域在一定程度上与Bias显著的区域相同(相关系数为0.55),此现象在南半球澳大利亚上空尤为明显。高度再指定使得该现象得到了显著改善(图 7b,7c),将Bias从13.0 m·s-1减少到了7.5 m·s-1。
|
图 7 2022年7月22日00时至24日00时快速抬升或快速下降云所对应的FY-4A云导风(a)高度再指定前Bias,(b)高度再指定后Bias,(c)高度再指定前后Bias的差,以及(d)24日00时前后两个时次云顶高度的变化 Fig. 7 (a-c) Bias for wind speed of FY-4A atmospheric motion vectors corresponding to rapidly ascending or descending clouds (a) before and (b) after height reassignment, (c) difference in Bias before and after height reassignment from 00:00 UTC 22 to 00:00 UTC 24, and (d) variation in cloud top height at two consecutive times at 00:00 UTC 24 July 2022 |
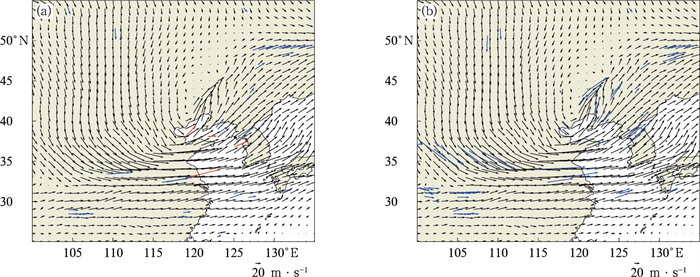
高度再指定后的云导风反映风场环流形势的能力有所增强。在2022年10月9日00时一次东北冷涡天气过程中(图 8),对比分析500 hPa高度上的云导风(选取所有高度为475~525 hPa样本)与环流背景场,经过高度再指定,更多此前位于其他高度(350~450 hPa)的云导风被再指定到了500 hPa等压面中,例如辽宁上空(40°~45°N、120°~125°E)的辐合急流带,一些不适当和不匹配的风矢量被从此层删除(图 8a中红色风矢),使东北冷涡(37°~43°N、117°~124°E)的气旋性(逆时针)风场流动及其西南侧的辐合急流带体现得更为明显(杨吉等,2020)。
|
图 8 2022年10月9日00时500 hPa等压面(475~525 hPa)云导风与ERA5风场(a)高度再指定前,(b)高度再指定后 注: 红色风矢为高度再指定前与周围背景场对比一致性较差的云导风, 黑色风矢为ERA5风场, 蓝色风矢为云导风, 下同。 Fig. 8 Atmospheric motion vectors at the 500 hPa isobaric surface (475-525 hPa) at 00:00 UTC 9 October 2022 compared with the ERA5 wind field (a) before height reassignment, (b) after height reassignment |
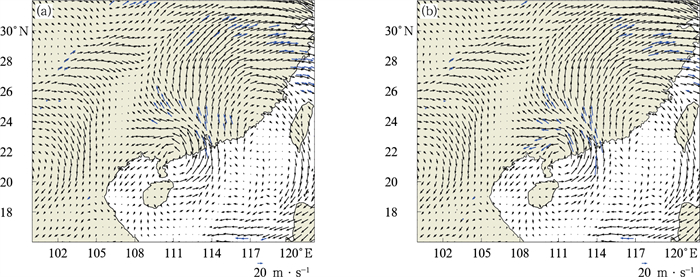
此外,还对比了2022年7月2日06时台风暹芭在我国登陆时的高层云导风观测风场(选取所有高度为150~250 hPa样本)与ERA5 200 hPa风场(图 9),高度再指定后,云导风所观测到的风场更加明显,对观测资料的订正起到了积极作用。
|
图 9 2022年7月2日06时200 hPa等压面(150~250 hPa)云导风与ERA5风场(a)高度再指定前,(b)高度再指定后 Fig. 9 Atmospheric motion vectors at the 200 hPa isobaric surface (150-250 hPa) at 06:00 UTC 2 July 2022 compared with the ERA5 wind field (a) before height reassignment, (b) after height reassignment |
提出了一种利用FY-4A云顶高度产品对云导风进行高度再指定的方法,并通过与ERA5再分析资料比较,评估了高度再指定后云导风质量的改进。主要结论如下:
(1) 经过高度再指定,低层云导风数量明显增加(平均从1116个增加到1768个),高层数量对应减少(平均从3056个减小到2385个),中层数量保持相对不变。整体高度的变化可能与二氧化碳切片法对中高层云上方光学薄卷云的剔除有关(Heidinger et al,2010)。
(2) 经过高度再指定后,各层存在的慢速偏差现象得到改善,各层均方根误差均有所降低,高层均方根误差的改善尤为显著(从订正前4.06 m·s-1降低到3.25 m·s-1),低层的平均绝对百分比误差改进较小。
(3) 针对高度再指定后高层云导风减少、低层云导风增加的情况,统计再指定后仍然在同一分层(即高层、中层和低层云导风)样本(高、中、低层平均数量分别为2527、699和1197个),发现其偏差和均方根误差同样均有所减小。
(4) 云顶的快速抬升或快速下降是导致云导风偏差增大的因素之一,本文提出的高度再指定方法能够在一定程度上减小此因素的影响。
(5) 经过高度再指定后,云导风得到的风场与实际环流特征的一致性有所改善。
综上所述,本文提出的基于云顶高度产品的云导风高度再指定方法,能够在一定程度上改进云导风产品精度。该方法不仅提高了云导风与背景风场的一致性,还能更好服务于天气系统的分析,辅助预报员提供更为准确的预报服务。
陈华, 许健民, 张其松, 等, 1999. 用高度调整法进行云迹风高度的质量控制[J]. 气象科学, 19(1): 20-25. Chen H, Xu J M, Zhang Q S, et al, 1999. The quality controlling of cloud winds using height updating[J]. J Meteor Sci, 19(1): 20-25 (in Chinese).
|
万晓敏, 龚建东, 韩威, 等, 2019. FY-4A云导风在GRAPES_RAFS中的同化应用评估[J]. 气象, 45(4): 458-468. Wan X M, Gong J D, Han W, et al, 2019. The evaluation of FY-4A AMVs in GRAPES_RAFS[J]. Meteor Mon, 45(4): 458-468 (in Chinese).
|
万晓敏, 田伟红, 韩威, 等, 2017. FY-2E云导风的算法改进及其在GRAPES中的同化应用研究[J]. 气象, 43(1): 1-10. Wan X M, Tian W H, Han W, et al, 2017. The evaluation of FY-2E reprocessed IR AMVs in GRAPES[J]. Meteor Mon, 43(1): 1-10 (in Chinese).
|
王富, 赵宇, 2021. 风云四号静止气象卫星的云顶高度反演算法[J]. 四川师范大学学报(自然科学版), 44(3): 412-418. Wang F, Zhao Y, 2021. An algorithm for retrieving cloud top height based on geostationary satellite data of Fengyun-4[J]. J Sichuan Normal Univ (Nat Sci), 44(3): 412-418 (in Chinese). DOI:10.3969/j.issn.1001-8395.2021.03.016
|
许健民, 2020. 风云二号气象卫星图像定位和卫星风精度的改善中解决问题的途径[J]. 南京信息工程大学学报, 12(1): 1-6. Xu J M, 2020. Pathways on solving problems at algorithm improvements for FY-2 meteorological satellite at image navigation and wind vector derivation[J]. J Nanjing Univ Inform Sci Technol, 12(1): 1-6 (in Chinese).
|
许健民, 张其松, 2006. 卫星风推导和应用综述[J]. 应用气象学报, 17(5): 574-582. Xu J M, Zhang Q S, 2006. Status review on atmospheric motion vectors-derivation and application[J]. J Appl Meteor Sci, 17(5): 574-582 (in Chinese).
|
薛纪善, 2009. 气象卫星资料同化的科学问题与前景[J]. 气象学报, 67(6): 903-911. Xue J S, 2009. Scientific issues and perspective of assimilation of meteorological satellite data[J]. Acta Meteor Sin, 67(6): 903-911 (in Chinese).
|
杨吉, 郑媛媛, 夏文梅, 等, 2020. 东北冷涡影响下江淮地区一次飑线过程的模拟分析[J]. 气象, 46(3): 357-366. Yang J, Zheng Y Y, Xia W M, et al, 2020. Numerical analysis of a squall line case influenced by northeast cold vortex over Yangtze-Huaihe River Valley[J]. Meteor Mon, 46(3): 357-366 (in Chinese).
|
杨璐, 宋林烨, 荆浩, 等, 2022. 复杂地形下高精度风场融合预报订正技术在冬奥会赛区风速预报中的应用研究[J]. 气象, 48(2): 162-176. Yang L, Song L Y, Jing H, et al, 2022. Fusion prediction and correction technique for high-resolution wind field in Winter Olympic Games area under complex terrain[J]. Meteor Mon, 48(2): 162-176 (in Chinese).
|
杨天杭, 顾明剑, 胡秀清, 等, 2021. 基于跨平台红外高光谱观测的对流层三维风场测量[J]. 光谱学与光谱分析, 41(4): 1131-1137. Yang T H, Gu M J, Hu X Q, et al, 2021. Tropospheric 3D winds measurement based on cross-platform infrared hyperspectral observation[J]. Spectrosc Spect Anal, 41(4): 1131-1137 (in Chinese).
|
张晓虎, 张其松, 许健民, 2017a. 半透明云风矢量高度算法中代表运动像元的使用[J]. 应用气象学报, 28(3): 270-282. Zhang X H, Zhang Q S, Xu J M, 2017a. Use of representative pixels of motion for wind vector height assignment of semi-transparent clouds[J]. J Appl Meteor Sci, 28(3): 270-282 (in Chinese).
|
张晓虎, 张其松, 许健民, 2017b. 半透明云风矢量高度算法中云下背景辐射的估计[J]. 应用气象学报, 28(3): 283-291. Zhang X H, Zhang Q S, Xu J M, 2017b. Estimation of background radiation underneath clouds for wind vector height assignment of semi-transparent clouds[J]. J Appl Meteor Sci, 28(3): 283-291 (in Chinese).
|
周润东, 夏攀, 张晓虎, 等, 2024. 气象卫星大气导风研究进展和未来展望[J]. 地球与行星物理论评, 55(2): 184-194. Zhou R D, Xia P, Zhang X H, et al, 2024. Research progress and prospects of atmospheric motion vector based on meteorological satellite images[J]. Rev Geophys Planet Phys, 55(2): 184-194 (in Chinese).
|
Baker W E, Atlas R, Cardinali C, et al, 2014. Lidar-measured wind profiles: the missing link in the global observing system[J]. Bull Amer Meteor Soc, 95(4): 543-564.
|
Borde R, Doutriaux-Boucher M, Dew G, et al, 2014. A direct link between feature tracking and height assignment of operational EUMETSAT atmospheric motion vectors[J]. J Atmos Ocean Technol, 31(1): 33-46.
|
Borde R, Oyama R, 2008. A direct link between feature tracking and height assignment of operational EUMETSAT atmospheric motion vectors[C]//9th International Winds Workshop. Annapolis: EBSCO.
|
Bormann N, Kelly G, Thépaut J N, 2002. Characterising and correcting speed biases in atmospheric motion vectors within the ECMWF system[C]. Proceedings of the Sixth International Winds Workshop: 113-120.
|
Bormann N, Saarinen S, Kelly G, et al, 2003. The spatial structure of observation errors in atmospheric motion vectors from geostationary satellite data[J]. Mon Wea Rev, 131(4): 706-718.
|
Bormann N, Thépaut J N, 2004. Impact of MODIS polar winds in ECMWF's 4DVAR data assimilation system[J]. Mon Wea Rev, 132(4): 929-940.
|
Daniels J, Bresky W, Wanzong S, et al, 2013. Atmospheric motion vectors derived via a new nested tracking algorithm developed for the GOES-R advanced baseline imager (ABI)[C]. Proceedings of the Ninth Annual Symposium on Future Operational Environmental Satellite Systems. Austin: 5-10.
|
Heidinger A K, Pavolonis M J, 2009. Gazing at cirrus clouds for 25 years through a split window.Part Ⅰ: methodology[J]. J Appl Meteor Climatol, 48(6): 1100-1116.
|
Heidinger A K, Pavolonis M J, Holz R E, et al, 2010. Using CALIPSO to explore the sensitivity to cirrus height in the infrared observations from NPOESS/VIIRS and GOES-R/ABI[J]. J Geophys Res Atmos, 115(D4): D00H20.
|
Le Marshall J, Rea A, Leslie L M, et al, 2004. Error characterisation of atmospheric motion vectors[J]. Aust Meteor Mag, 53(2): 123-131.
|
Lean K, Bormann N, 2023. Using model cloud information to reassign low-level atmospheric motion vectors in the ECMWF assimilation system[J]. J Appl Meteor Climatol, 62(3): 361-376.
|
Li D, Liu Y Z, Luo R, et al, 2024. Validation and revision of low latitudes cloud base height from ERA5[J]. Atmos Res, 309: 107595.
|
Liang J H, Chen K Y, Xian Z P, 2021. Assessment of FY-2G atmospheric motion vector data and assimilating impacts on typhoon forecasts[J]. Earth Space Sci, 8(6): e2020EA001628.
|
Min M, Li J, Wang F, et al, 2020. Retrieval of cloud top properties from advanced geostationary satellite imager measurements based on machine learning algorithms[J]. Remote Sensing Environ, 239: 111616.
|
Nieman S J, Paul Menzei W, Hayden C M, et al, 1997. Fully automated cloud-drift winds in NESDIS operations[J]. Bull Am Meteor Soc, 78(6): 1121-1134.
|
Oh S M, Borde R, Carranza M, et al, 2019. Development and intercomparison study of an atmospheric motion vector retrieval algorithm for GEO-KOMPSAT-2A[J]. Remote Sensing, 11(17): 2054.
|
Paul Menzel W, Frey R A, Baum B A, et al, 2010. Cloud top properties and cloud phase algorithm theoretical basis document[R/OL]. [2024-05-16]. NASA Goddard Space Flight Center. http://modis.gsfc.nasa.gov/data/atbd/atbd_mod04.pdf
|
Roebeling R, Baum B, Bennartz R, et al, 2013. Evaluating and improv-ing cloud parameter retrievals[J]. Bull Amer Meteor Soc, 94(4): ES41-ES44.
|
Stoffelen A, Benedetti A, Borde R, et al, 2020. Wind profile satellite observation requirements and capabilities[J]. Bull Amer Meteor Soc, 101(11): E2005-E2021.
|
Tan Z H, Ma S, Zhao X B, et al, 2019. Evaluation of cloud top height retrievals from China's next-generation geostationary meteorological satellite FY-4A[J]. J Meteor Res, 33(3): 553-562.
|
Velden C, Daniels J, Stettner D, et al, 2005. Recent innovations in deriving tropospheric winds from meteorological satellites[J]. Bull Amer Meteor Soc, 86(2): 205-224.
|
Velden C S, Bedka K M, 2009. Identifying the uncertainty in determin-ing satellite-derived atmospheric motion vector height attribution[J]. J Appl Meteor Climatol, 48(3): 450-463.
|
Verlinden K L, Thompson D W J, Stephens G L, 2011. The three-dimensional distribution of clouds over the Southern Hemisphere high latitudes[J]. J Climate, 24(22): 5799-5811.
|
Wang F, Min M, Xu N, et al, 2022. Effects of linear calibration errors at low-temperature end of thermal infrared band: lesson from failures in cloud top property retrieval of Fengyun-4A geostationary satellite[J]. IEEE Trans Geosci Remote Sens, 60: 5001511.
|
Wanzong S, Heidinger A, Daniels J, et al, 2016. Comparison of the optimal cloud analysis product (OCA) and the goes-R ABI cloud height algorithm (ACHA) cloud top pressures for AMVS[R/OL][2024-05-16]. Monterey: Proceedings for the 13th International Winds Workshop. https://cgms-info.org/html/iww13/proceedings_iww13/papers/session3/IWW13_Session3_5_Wanzong_final.pdf
|
Xu J, Holmlund K, Zhang Q, et al, 2002. Comparison of two schemes for derivation of atmospheric motion vectors[J]. J Geophys Res Atmos, 107(D14): ACL 4-1-ACL 4-15.
|
Xu J M, Zhang Q S, Xiang F, et al, 1998. Cloud motion winds from FY-2 and GMS-5 meteorological satellites[C]//Proceedings of the 4th International Winds Workshop. Saanenmöser: EUMETSAT Publication: 41-48.
|
Yang C Y, Lu Q F, Zhang P, 2012. A study on height reassignment for the AMV products of the FY-2C satellite[J]. Acta Meteor Sin, 26(5): 614-628.
|
Yao B, Teng S W, Lai R Z, et al, 2020. Can atmospheric reanalyses (CRA and ERA5) represent cloud spatiotemporal characteristics?[J]. Atmos Res, 244: 105091.
|
Zhao F M, Tang C L, Dai C M, et al, 2020. The global distribution of cirrus clouds reflectance based on MODIS level-3 data[J]. Atmosphere, 11(2): 219.
|
 2025, Vol. 51
