2. 重庆气象局,重庆 401147
2. Chongqing Meteorological Service, Chonqing 401147
研究表明冰雹微物理过程会直接影响雹云降水过程。冰雹的湿增长是影响雹云降水过程的首要机制(Rasmussen and Heymsfield, 1987; List,2014)。冰雹融化制冷会使下沉气流增强,是下击暴流的重要形成因素(Srivastava,1987; Atlas et al,2004)。冰雹粒子谱随冰雹融化和湿增长过程变化,冰雹尺度较小的雹云地面总降水范围大、强度小,仅有少量冰雹能降落到地面,冰雹尺度较大的雹云地面总降水范围小、强度大,并伴有大量冰雹落至地面(Gilmore et al,2004; van den Heever and Cotton, 2004)。相较于同等质量的大冰雹,冰雹尺度较小的雹云低层冷池更强,强冷池会影响雹云的移动和生命时间(van den Heever and Cotton, 2004)。Zeng et al (2001)从微物理角度研究了深对流降水过程,结果表明存在冰雹的深对流云较无冰雹的深对流云降水过程发展更快。Morrison and Milbrandt(2011)研究指出,冰雹的落速增强会抑制上升运动,增强冷池和地面总降水,进而影响雹云的结构和生命时间(Bryan and Morrison, 2012; Adams-Selin et al,2013)。研究还指出,微物理过程会影响中尺度对流系统的降水特征,包括强度、分布和持续时间,并对大尺度环境特征产生反馈(Feng et al,2018;Bae et al, 2019)。
作为农业大国,冰雹灾害是中国最为严重的自然灾害之一。我国每年因冰雹灾害造成的经济损失高达数十亿元(张芳华和高辉,2008),严重的冰雹灾害还可能导致人员伤亡和房屋破坏。目前,受限于分辨率的限制,常用业务数值预报模式鲜少将冰雹作为预报量。随着模式分辨率的提高,达到1 km甚至百米级别,区域高分辨率模式已经能够模拟出有利于冰雹形成的强烈上升气流。因此,在区域高分辨率模式中引入冰雹微物理过程,将有助于更准确地模拟包括强对流天气如飑线在内的天气过程。本研究采用中国气象局自主研发的中尺度天气数值预报系统(CMA-MESO,原GRAPES_MESO),分别运用无冰雹和含冰雹微物理过程的方案进行模拟,来研究对流云降水过程。通过对比观测数据与模拟结果,分析对流云的宏观和微观结构、降水特征以及相关微物理过程的差异,旨在评估现有业务模式对冰雹云降水过程的预报能力,为提高强对流性天气的精细预报能力奠定研究基础。
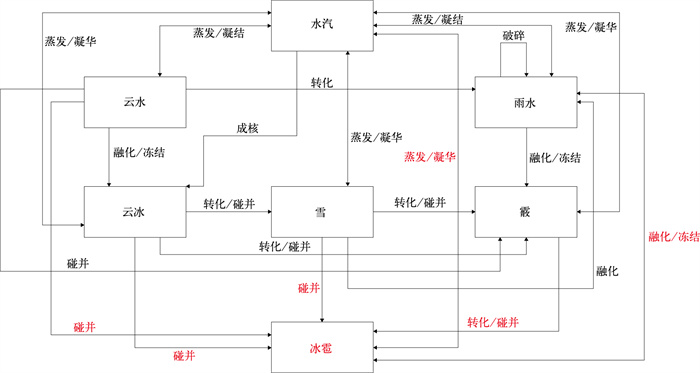
1 模式介绍与试验设计 1.1 模式介绍本研究所使用的模式为中尺度天气数值预报系统CMA-MESO。2006年,该模式正式业务运行并为各级气象机构提供产品。经过不断研发,其业务预报能力得到提高,也适宜开展多种科学研究(邓华等,2008; 黄丽萍等,2012; 王金成等,2014; 2024;万子为等,2015; 2024;Wang et al,2017;徐枝芳和王瑞春,2022;王瑞文等,2023;蔡怡等,2023)。CMA-MESO中使用双参数混合相态云微物理方案(胡志晋和何观芳,1987),该方案包含5种水凝物作为预报量,除云滴只可预报质量混合比外,可预报雨滴、冰晶、雪、霰的质量混合比和数量混合比。在本研究中,增加了新的预报量冰雹及相关微物理过程,见图 1。
|
图 1 CMA-MESO双参数微物理方案示意图 注:红色字体为本研究新增过程。 Fig. 1 Schematic diagram of the CMA-MESO double-moment microphysical scheme |
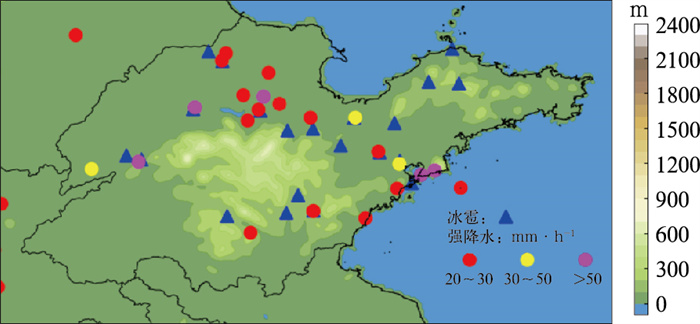
2018年6月13日,华北地区出现了一次强对流天气过程。从6月12日下午开始,一条强飑线袭击了内蒙古南部、山西、河北、北京和山东。图 2显示13日00时至14日00时(全文均为世界时)期间,山东省出现的灾害天气(强降水和冰雹),数据来自中国气象数据服务中心(http://data.cma.cn/)。这一过程中,青岛市风速约为20 m·s-1,最大风速为34.8 m·s-1,小时降水量甚至超过50 mm。图中蓝色三角形表示观测到冰雹的位置,在这一过程中,冰雹的典型直径约为5~20 mm,最大超过20 mm。相关的冰雹造成了重大人员伤亡和经济损失。近86万人受灾,2人死亡,1人失踪,4100多所房屋受损。农作物受损面积为10.58万m2,直接经济损失近10亿元。
|
图 2 2018年6月13日00时至14日00时山东省的灾害天气实况(符号)和地形高度(填色) Fig. 2 Hazard weather reports (symbol) in Shandong Province from 00:00 UTC 13 to 00:00 UTC 14 June 2018 combined with terrain height (colored) |
与本次对流云降水过程相关的天气尺度背景如图 3所示,6月13日06时,500 hPa的大气环流特征为来自华北平原东北方向的冷涡,如图 3b所示。山东省位于冷涡底部、东亚槽前方,有利于垂直向上运动。同时,华北平原存在暖低压,该地区来自北方的强中层冷空气平流与来自南方的低层暖平流叠加,导致大气不稳定。

|
图 3 2018年6月13日06时(a)200 hPa、(b)500 hPa的位势高度(蓝色实线,单位:dagpm)、温度(红色虚线,单位:℃)和风场(风羽) Fig. 3 Geopotential height (blue solid line, unit: dagpm), temperature (red dashed line, unit: ℃) and wind field (barb) at (a) 200 hPa and (b) 500 hPa at 06:00 UTC 13 June 2018 |
研究中使用CMA-MESO模拟此次对流云降水过程时,初始和边界条件由美国国家环境预测中心(NCEP)6 h再分析数据提供。模式水平分辨率为0.01°,模拟区域覆盖山东省,模拟期从2018年6月12日12时开始,持续36 h。采用无冰雹(控制组)和含冰雹(试验组)两组情况进行模拟。
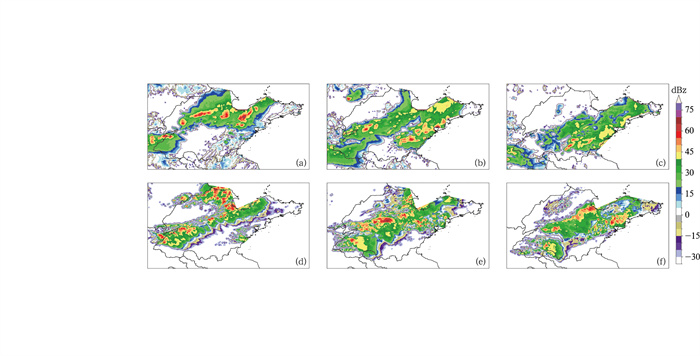
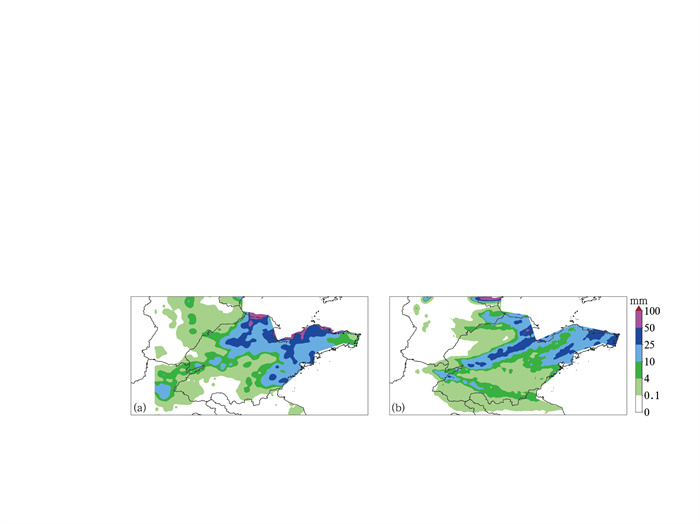
1.3 结果验证图 4选取了2018年6月13日3个时次的实际观测与控制组模拟的雷达组合反射率,雷达观测资料来源于MOSAIC雷达网。从观测的雷达组合反射率中可以看出本次飑线对流的移动过程。4 h内,飑线由山东西北向东南方向移动,并最终移出山东省。观测的飑线具有较高的组合反射率,最高可达65 dBz。与观测相比,模式结果中的飑线移动方向及速度较为符合。模拟的雷达组合反射率较观测的雷达组合反射率稍大。图 5为2018年6月13日24 h累计降水量,从图 5可见,观测降水量最大在50 mm以上,降水中心位于山东东北部沿海;模拟结果中最大也达到50 mm, 强降水区同样位于山东东北部沿岸。与观测相比,模拟的降水雨带在山东省内更为窄长,这可能是与观测资料分辨率为5 km,无法刻画降水更加细致的结构有关。
|
图 4 2018年6月13日(a~c)观测和(d~f)控制组模拟的雷达组合反射率(a, d)07时, (b, e)09时, (c, f)11时 Fig. 4 Composite reflectivity from (a-c) operational radars, and (d-f) model simulation of the control group on 13 June 2018 (a, d) 07:00 UTC, (b, e) 09:00 UTC, (c, f) 11:00 UTC |
|
图 5 2018年6月13日00时至14日00时(a)观测与(b)控制组模拟的24 h累计降水量 Fig. 5 The 24 h accumulated precipitation of (a) observation and (b) model simulation of the control group from 00:00 UTC 13 to 00:00 UTC 14 June 2018 |
总之,本次模拟的组合反射率移动路径与实况基本一致,生命周期与实况相当,并且模拟的降水量与观测的量级大小、位置均较为吻合,具有合理性,此次过程基本被模拟再现。
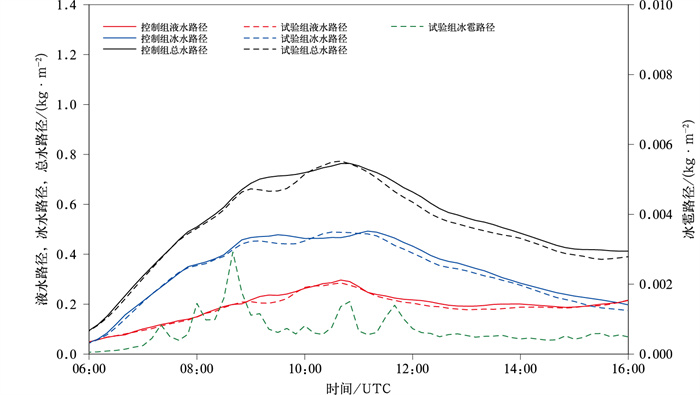
2 结果分析 2.1 对流云宏观特征本文使用云水路径描述对流云发展的特征,单位面积柱内液水、冰水及总水质量混合比的垂直积分分别称为液水路径、冰水路径、总水路径,冰雹质量混合比的垂直积分称为冰雹路径。云水路径受环流、地形、湿度分布及水汽传输影响,研究表明气溶胶也会影响云水路径(石茹琳等,2021;张喆等,2017)。图 6为2018年6月13日06—16时对流云发展过程中区域平均的云水路径随时间的变化。由图可见,增加冰雹后,云中液水路径、冰水路径均有变化。13日08时起,对流云开始发展,10时后较为稳定,并在12时减弱,其中冰雹路径在08—12时较多,在08:40左右达到高峰。对流发展旺盛期,冰水路径显著大于液水路径。对流发展前期(06时),控制组CAPE区域平均为810.36 J·kg-1,试验组则为812.08 J·kg-1,稍强于控制组;而对流发展中后期,试验组的液水路径、冰水路径均小于控制组。这可能与对流发展前期,试验组对流更加旺盛,而对流发展中后期,冰雹微物理过程的增加促进了云中水凝物的消耗有关。
|
图 6 2018年6月13日06—16时控制组(实线)和试验组(虚线)模拟的区域平均的云水路径随时间的变化 Fig. 6 Time evolution of regional averaged cloud water path in control (solid line) and experimental (dashed line) groups from 06:00 UTC to 16:00 UTC 13 June 2018 |
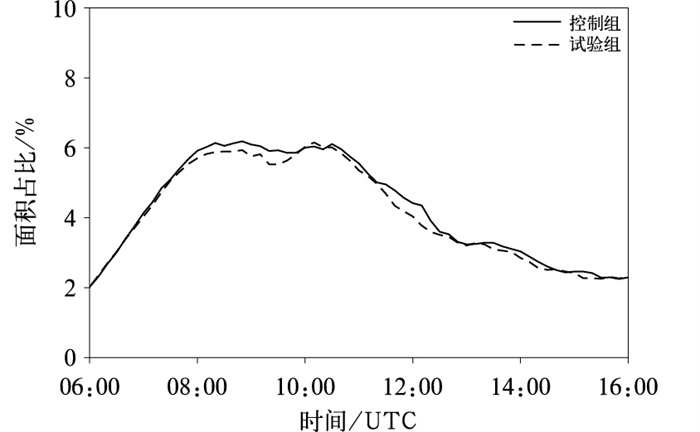
在后续分析中,本文将着重讨论对流核心区(垂直速度峰值大于2 m·s-1的区域)的云宏观和微观结构特征。图 7为6月13日06—16时对流核心区面积占模拟总区域面积的比例。由图可知,随着对流过程的发展,对流核心区的面积占比先上升、后下降,其中08—11时超过总模拟区域面积的5%。与控制组相比,试验组的对流核心区面积占比有所下降,差值最大可达1%。
|
图 7 2018年6月13日06—16时控制组(实线) 和试验组(虚线)模拟的对流核心区面积与总区域面积之比随时间的变化 Fig. 7 Time evolution of the percentage of regional convective core area to total area in control (solid line) and experimental (dashed line) groups from 06:00 UTC to 16:00 UTC 13 June 2018 |
增加冰雹对气流垂直运动有一定的影响(Chen et al,2020; 石茹琳等,2021)。本文选取6月13日06—16时对流核心区垂直速度及变温率垂直分布随时间变化的情况(图 8)进行分析。由图 8可知,对流核心区垂直速度峰值位于400 hPa,0℃以上的过冷区内。08—12时,相较控制组,试验组对流核心区垂直速度略有增大(差值可达0.15 m·s-1, 图略),其余时刻略有减弱。在冰雹产生的初期(08—09时),试验组的总水凝物在对流核心区更多(差值可达0.1 g·kg-1, 图略),试验组通过微物理成冰及冰相粒子生长过程释放潜热更多(如图 8c, 8d)。

|
图 8 2018年6月13日06—16时(a,c)控制组和(b,d)试验组模拟的对流核心区(a,b)垂直速度与(c,d)变温率的垂直分布随时间的变化 Fig. 8 Height-time variation of (a, b) vertical velocity and (c, d) temperature tendency in regional convective core in (a, c) control and (b, d) experimental groups from 06:00 UTC to 16:00 UTC 13 June 2018 |
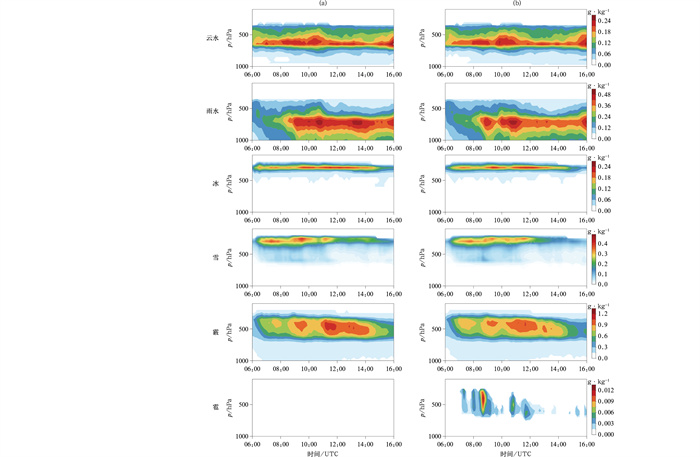
图 9为6月13日06—16时控制组和试验组水凝物在对流核心区质量混合比的垂直分布情况。由图 9a可知,云水质量混合比的极大值出现在650 hPa附近及以上高度,即0℃层附近。控制组云水质量混合比峰值为0.37 g·kg-1,试验组峰值为0.39 g· kg-1。雨水质量混合比的极大值位于云水质量混合比峰值以下,即0℃层以下。相较于控制组,试验组雨水质量混合比峰值较弱。
|
图 9 2018年6月13日06—16时(a)控制组和(b)试验组模拟的对流核心区云水凝物质量混合比垂直分布随时间的变化 Fig. 9 Height-time variation of cloud hydrometeor mass mixing ratio in regional convective core in (a) control and (b) experimental groups from 06:00 UTC to 16:00 UTC 13 June 2018 |
对冰相水凝物而言,冰晶位于-30~-10℃的高度,峰值约在250 hPa附近,增加冰雹对冰晶质量混合比峰值的位置与温度区间影响有限。在09时,冰雹生成比较旺盛,试验组雪、霰的质量混合比较控制组有所减少,其中霰的质量混合比下降更为明显。霰的转化生成雹胚,并通过与冰、雪、霰碰并长大,是冰雹的重要来源。冰雹的质量混合比峰值出现时间较短,其峰值相对其他水凝物质量混合比较低,这是由于冰雹出现范围较小而图中展示的仅为平均的结果。在试验组中,冰雹最开始通过霰粒转化产生,通过碰并过程生长,多数冰雹下落至0℃层后,快速融化。当冰雹产生时,由于冰雹的下落速度强于其他水凝物,在下落过程中融化吸热比控制组更多,抑制对流的发展,因此图 6中总水路径下降,图 7中对流核心区面积与总模拟区域面积之比降低,这与以往的研究结果一致(Morrison and Milbrandt, 2011)。
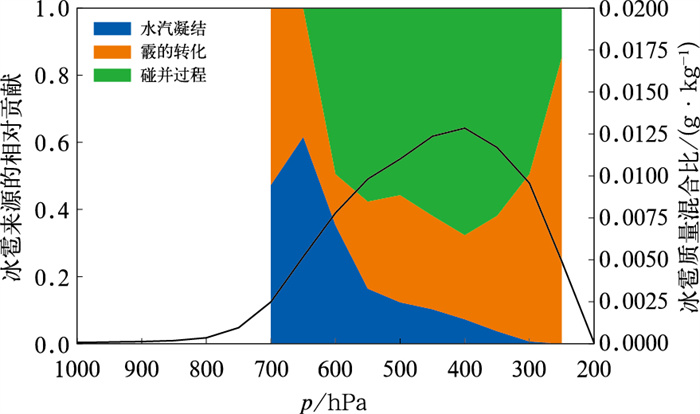
图 10为对流核心区平均冰雹质量混合比达到峰值时(08:40),冰雹来源随高度的相对贡献。由图分析对流核心区自上而下的变化。在300 hPa, 霰自动转换为冰雹胚随后增长;在500~400 hPa,即冰雹质量混合比垂直极大时,冰雹增长的主要来源为与其他种类水凝物的碰并过程,这是由于该高度冰相水凝物质量混合比较高,有利于碰并过程的发生;在700~600 hPa,冰雹的增长主要来源于水汽凝华,这与该高度的水汽较多有关。
|
图 10 2018年6月13日08:40冰雹各个来源的相对贡献随高度的变化 注:黑线为该时刻对流核心区冰雹质量混合比廓线。 Fig. 10 Variation of relative contribution of the proportion of hail sources with altitude at 08:40 UTC 13 June 2018 |
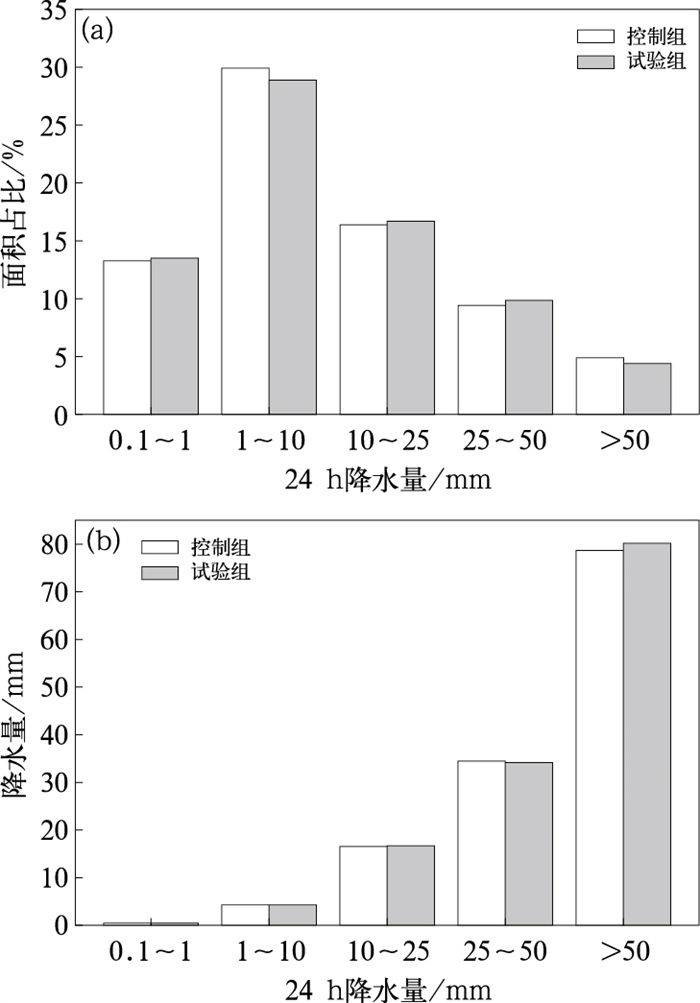
图 11为6月13日13日00时至14日00时累计降水中不同量级降水面积占总降水面积的比例,以及不同量级降水量的平均值。由图所示,增加冰雹会影响对流云降水过程,试验组的中雨[1~10 mm ·(24 h)-1]面积占总降水面积比例减少,而大雨及以上[>10 mm·(24 h)-1]面积占总降水面积比例稍有增加。就降水量而言,增加冰雹后,中小量级降水强度无明显变化,而大雨及以上量级降水的强度增大,50 mm·(24 h)-1以上量级降水差值可达2.5 mm· (24 h)-1。增加冰雹后,对流发展前期,核心区垂直速度增加,冰相降水增强,大雨强度增加,而对流中后期发展受抑制,中雨面积占总降水面积降低。
|
图 11 2018年6月13日13日00时至14日00时24 h累计降水统计(a)不同量级降水面积占总降水面积的比例,(b)不同量级降水量平均值 Fig. 11 (a) The proportion of areas with different levels of precipitation to the total precipitation area and (b) the average of different levels of precipitation in the 24 h total precipitation from 00:00 UTC 13 to 00:00 UTC 14 June 2018 |
本文利用CMA-MESO业务模式,选用含冰雹及不含冰雹的两组试验,对山东一次对流云降水过程进行了数值模拟。得到如下结论:
(1) CMA-MESO较好地模拟了这次对流降水过程,观测的飑线具有较高的组合反射率,最高可达65 dBz。与观测相比,模式结果中的飑线移动方向及速度基本一致,生命周期与实况相当。24 h累计降水分布和量级也与观测数据基本一致。
(2) 对流发展前期,控制组CAPE低于试验组;对流发展中后期,模拟区域的平均液水、冰水路径则是控制组高于试验组。这可能与对流发展前期,产生冰雹的试验组对流更加旺盛,而对流发展中后期,冰雹微物理过程的增加促进了云中水凝物的消耗有关。试验组对流核心区垂直速度在对流发展时略有增强,其余时候有所下降,这是由于冰雹的生成,试验组的总水凝物在对流核心区更多,通过微物理成冰及冰相粒子生长过程释放更多的潜热,垂直速度增加。当冰雹产生时,由于冰雹的下落速度大于其他水凝物,因此在下落过程中融化吸热比无冰雹的控制组更多,这会一定程度上抑制对流的发展。
(3) 增加冰雹会影响对流降水,不同量级的降水影响各不相同。增加冰雹后,对流发展前期,对流核心区垂直速度增加,冰相降水增强,大雨强度增加;对流的中后期发展受到抑制,中雨覆盖的区域在总降水面积中的比例有所下降。
蔡怡, 徐枝芳, 朱克云, 等, 2023. CMA-MESO 3 km系统2 m温度预报诊断[J]. 气象, 49(4): 400-414. Cai Y, Xu Z F, Zhu K Y, et al, 2023. Diagnosis of 2 m temperature prediction by CMA-MESO system with 3 km resolution[J]. Meteor Mon, 49(4): 400-414 (in Chinese).
|
邓华, 薛纪善, 徐海明, 等, 2008. GRAPES中尺度模式中不同对流参数化方案模拟对流激发的研究[J]. 热带气象学报, 24(4): 327-334. Deng H, Xue J S, Xu H M, et al, 2008. Study of different cumulus parameterization schemes of GRAPES-MESO model in simulation of convection provocation[J]. J Trop Meteor, 24(4): 327-334 (in Chinese). DOI:10.3969/j.issn.1004-4965.2008.04.003
|
胡志晋, 何观芳, 1987. 积雨云微物理过程的数值模拟——(一)微物理模式[J]. 气象学报, 45(4): 467-484. Hu Z J, He G F, 1987. Numerical simulation of microprocesses in cumulonimbus clouds (Ⅰ) microphysical model[J]. Acta Meteor Sin, 45(4): 467-484 (in Chinese).
|
黄丽萍, 陈德辉, 马明, 2012. 高分辨中尺度雷电预报模式GRAPES_LM的建立及其初步应用试验[J]. 气象学报, 70(2): 291-301. Huang L P, Chen D H, Ma M, 2012. The GRAPES high resolution mesoscale lightning forecast model and its preliminary validation[J]. Acta Meteor Sin, 70(2): 291-301 (in Chinese).
|
石茹琳, 银燕, 陈倩, 等, 2021. 气溶胶对新疆冰雹形成物理过程影响的数值模拟研究[J]. 大气科学, 45(1): 107-122. Shi R L, Yin Y, Chen Q, et al, 2021. Numerical simulation of aerosol effects on the physical processes of hail formation in Xinjiang[J]. Chin J Atmos Sci, 45(1): 107-122 (in Chinese).
|
万子为, 孙思远, 赵滨, 等, 2024. CMA-MESO模式对"21·7"河南特大暴雨的预报评估与误差分析[J]. 气象, 50(1): 33-47. Wan Z W, Sun S Y, Zhao B, et al, 2024. Evaluation and error analysis of the July 2021 extremely severe rainstorm in Henan Province simulated by CMA-MESO model[J]. Meteor Mon, 50(1): 33-47 (in Chinese).
|
万子为, 王建捷, 黄丽萍, 等, 2015. GRAPES-MESO模式浅对流参数化的改进与试验[J]. 气象学报, 73(6): 1066-1079. Wan Z W, Wang J J, Huang L P, et al, 2015. An improvement of the shallow convection parameterization scheme in the GRAPES-MESO[J]. Acta Meteor Sin, 73(6): 1066-1079 (in Chinese).
|
王金成, 龚建东, 邓莲堂, 2014. GNSS反演资料在GRAPES_MESO三维变分中的应用[J]. 应用气象学报, 25(6): 654-668. Wang J C, Gong J D, Deng L T, 2014. Operational assimilation of data retrieved by GNSS observations into GRAPES_MESO 3DVar system[J]. J Appl Meteor Sci, 25(6): 654-668 (in Chinese).
|
王金成, 王丹, 王瑞文, 等, 2024. 往返平飘式探空在CMA-MESO三维变分中的同化及对模式预报的影响[J]. 气象, 50(2): 159-169. Wang J C, Wang D, Wang R W, et al, 2024. Assimilation of round-trip horizontal drift radiosonde data in CMA-MESO 3DVar and its impact on model forecast[J]. Meteor Mon, 50(2): 159-169 (in Chinese).
|
王瑞文, 王金成, 王丹, 等, 2023. 往返平飘式探空观测系统对CMA-MESO的影响研究[J]. 气象, 49(1): 52-61. Wang R W, Wang J C, Wang D, et al, 2023. Study on the influence of return sounding observation system based on CMA-MESO[J]. Meteor Mon, 49(1): 52-61 (in Chinese).
|
徐枝芳, 王瑞春, 2022. 背景误差尺度分离与多尺度混合滤波技术在CMA-MESO 3 km系统的应用[J]. 气象, 48(12): 1525-1538. Xu Z F, Wang R C, 2022. Multiscale separation of background error for multiscale filtering in CMA-MESO 3 km resolution system[J]. Meteor Mon, 48(12): 1525-1538 (in Chinese). DOI:10.7519/j.issn.1000-0526.2022.081501
|
张芳华, 高辉, 2008. 中国冰雹日数的时空分布特征[J]. 大气科学学报, 31(5): 687-693. Zhang F H, Gao H, 2008. Temproal and spatial features of hail days in China[J]. Trans Atmos Sci, 31(5): 687-693 (in Chinese). DOI:10.3969/j.issn.1674-7097.2008.05.011
|
张喆, 丁建丽, 王瑾杰, 2017. 中亚地区气溶胶时空分布及其对云和降水的影响[J]. 环境科学学报, 37(1): 61-72. Zhang Z, Ding J L, Wang J J, 2017. Temporal distribution of cloud and precipitation and their possible relationships with surface aerosols in Central Asia[J]. Acta Sci Circumstantiae, 37(1): 61-72 (in Chinese).
|
Adams-Selin R D, Van Den Heever S C, Johnson R H, 2013. Impact of graupel parameterization schemes on idealized bow echo simulations[J]. Mon Wea Rev, 141(4): 1241-1262. DOI:10.1175/MWR-D-12-00064.1
|
Atlas D, Ulbrich C W, Williams C R, 2004. Physical origin of a wet microburst: observations and theory[J]. J Atmos Sci, 61(10): 1186-1195. DOI:10.1175/1520-0469(2004)061<1186:POOAWM>2.0.CO;2
|
Bae S Y, Hong S Y, Tao W K, 2019. Development of a single-moment cloud microphysics scheme with prognostic hail for the weather research and forecasting (WRF) model[J]. Asia-Pac J Atmos Sci, 55(2): 233-245. DOI:10.1007/s13143-018-0066-3
|
Bryan G H, Morrison H, 2012. Sensitivity of a simulated squall line to horizontal resolution and parameterization of microphysics[J]. Mon Wea Rev, 140(1): 202-225. DOI:10.1175/MWR-D-11-00046.1
|
Chen Q, Fan J W, Yin Y, et al, 2020. Aerosol impacts on mesoscale convective systems forming under different vertical wind shear conditions[J]. J Geophys Res-Atmos, 125(3): e2018JD030027. DOI:10.1029/2018JD030027
|
Feng Z, Leung L R, Houze R A, et al, 2018. Structure and evolution of mesoscale convective systems: sensitivity to cloud microphysics in convection-permitting simulations over the United States[J]. J Adv Model Earth Syst, 10(7): 1470-1494. DOI:10.1029/2018MS001305
|
Gilmore M S, Straka J M, Rasmussen E N, 2004. Precipitation uncertainty due to variations in precipitation particle parameters within a simple microphysics scheme[J]. Mon Wea Rev, 132(11): 2610-2627. DOI:10.1175/MWR2810.1
|
List R, 2014. New hailstone physics.Part Ⅰ: heat and mass transfer (HMT) and growth[J]. J Atmos Sci, 71(4): 1508-1520. DOI:10.1175/JAS-D-12-0164.1
|
Morrison H, Milbrandt J, 2011. Comparison of two-moment bulk microphysics schemes in idealized supercell thunderstorm simulations[J]. Mon Wea Rev, 139(4): 1103-1130. DOI:10.1175/2010MWR3433.1
|
Rasmussen R M, Heymsfield A J, 1987. Melting and shedding of graupel and hail.Part Ⅰ: model physics[J]. J Atmos Sci, 44(19): 2754-2763. DOI:10.1175/1520-0469(1987)044<2754:MASOGA>2.0.CO;2
|
Srivastava R C, 1987. A model of intense downdrafts driven by the melting and evaporation of precipitation[J]. J Atmos Sci, 44(13): 1752-1774. DOI:10.1175/1520-0469(1987)044<1752:AMOIDD>2.0.CO;2
|
van den Heever S C, Cotton W R, 2004. The impact of hail size on simulated supercell storms[J]. J Atmos Sci, 61(13): 1596-1609. DOI:10.1175/1520-0469(2004)061<1596:TIOHSO>2.0.CO;2
|
Wang L L, Chen D H, Bao H J, et al, 2017. On simulation improvement of the Noah_LSM by coupling with a hydrological model using a double-excess runoff production scheme in the GRAPES_ Meso model[J]. Meteor Appl, 24(3): 512-520. DOI:10.1002/met.1651
|
Zeng Z X, Yuter S E, Houze R A, et al, 2001. Microphysics of the rapid development on heavy convective precipitation[J]. Mon Wea Rev, 129: 1882-1904. DOI:10.1175/1520-0493(2001)129<1882:MOTRDO>2.0.CO;2
|
 2025, Vol. 51
